Blue Line Wide Template Table1
RJ0200066_14
- Last Update 04/18/2025
- File Size 0.1MB
- # of Slides 2
- File Format PPTX
- Slide Ratio 16:9
- Color
Keywords
About the Product
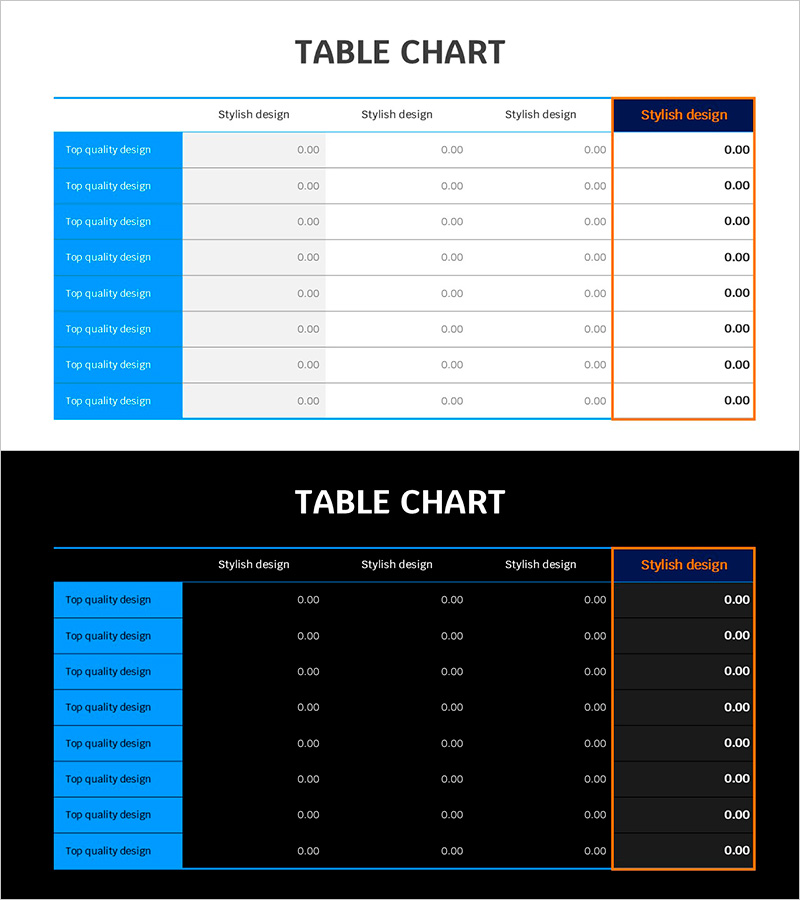
A professional 8-row by 4-column table PowerPoint slide designed for organizing financial metrics and performance data. The left row headers feature a bright blue background for clear categorization, while the rightmost column is highlighted with an orange border to emphasize key figures. The light background and crisp grid lines ensure excellent data readability, with ample input areas for comparing multiple financial items and quarterly performance metrics. This presentation slide is ready to use in reports, dashboards, and business presentations.
Usage Points
-
Main Usage
Organize and compare quantitative data such as financial plans, quarterly performance, and departmental metrics in table format. The left row headers and right accent column clearly distinguish main items and key figures, directing audience attention to critical information.
-
How to Use
Enter financial figures, performance indicators, department names, and period information into each cell. The light background and clear gridlines work well for both printed and screen presentations. Use color emphasis to highlight important data. Suitable for reports, business plans, and performance presentations.
-
Recommended For
CFOs, financial analysts, business managers, and performance evaluators presenting quarterly financial status, departmental performance, and budget execution. Ideal for investor presentations, executive briefings, and internal performance-sharing meetings to enhance data credibility.
-
Slide Structure
8-row (including header) × 4-column layout with bright blue background row headers on the left for item names, white background data entry areas in the center three columns, and an orange-bordered rightmost column highlighting key metrics. Two-slide set provides multiple table layout options.
Related Products
-

Logistics Factor Comparison Table – Intuitive Data Analysis
#Financial Plans and Performance #Diagram #Sales and Revenue
-

Cost Table by Beans – Unique Financial Analysis
#Financial Plans and Performance #Diagram #Sales and Revenue
-

Grain Yield Table – Financial Planning and Performance
#Financial Plans and Performance #Diagram #Sales and Revenue
-

Colors Theme Presentation Template Table – Financial Planning and Performance
#Financial Plans and Performance #Diagram #Sales and Revenue
