Quality PowerPoint Table Template for Financial Performance Visualization
RJ0200020_18
- Last Update 04/02/2025
- File Size 6.2MB
- # of Slides 2
- File Format PPTX
- Slide Ratio 16:9
- Color
Keywords
- #Content-Based Slides
- #Design-Based Slides
- #Financial Plans and Performance
- #Diagram
- #Sales and Revenue
- #Key Financial Indicators
- #Table
- #Standard Table
- #16:9
- #table PowerPoint slide
- #financial data table template
- #performance comparison slide
- #5-column data visualization
- #business metrics PowerPoint
- #how to create data table in PowerPoint
About the Product
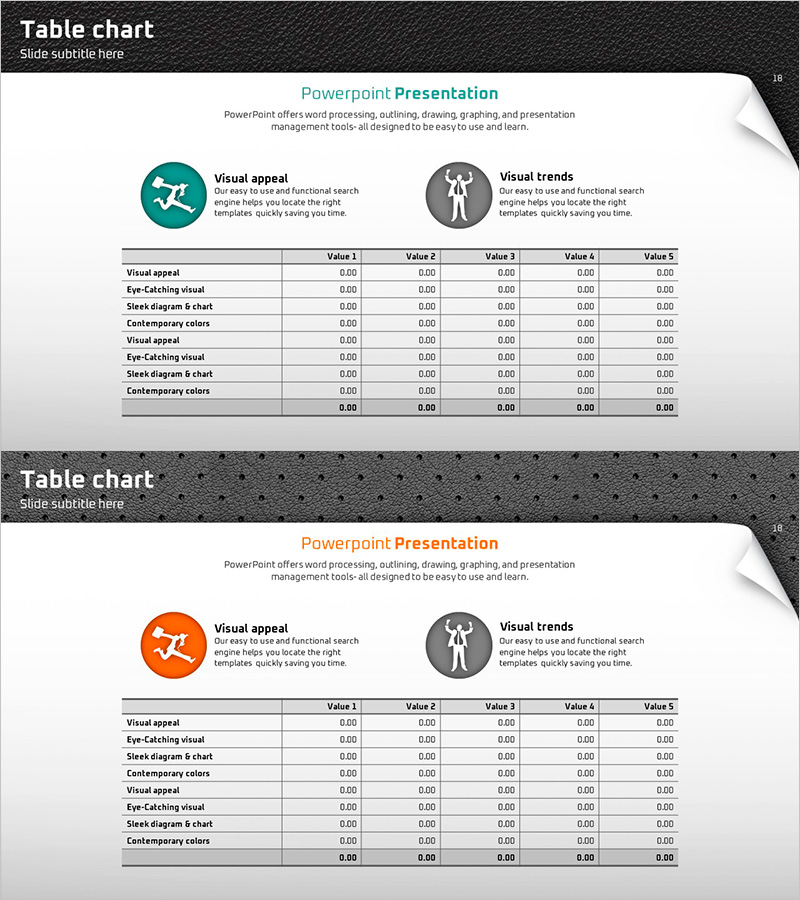
A professional PowerPoint table slide designed for visualizing financial performance and key metrics with clarity and impact. The 5-column, 9-row data table is optimized for numerical comparison and performance analysis across departments or time periods. Dark gray headers contrast with white cells to enhance readability, while left-aligned circular icons (running figure and human silhouette) provide visual emphasis and section identification. The 2-slide set features multiple color variations (teal, orange, teal accent) for flexible presentation customization and immediate use in business reports and investor presentations.
Usage Points
-
Main Usage
Organize and compare financial results, sales performance, departmental KPIs, and quarterly metrics in a structured table format. The dark header and white cell contrast creates clear information hierarchy, while side icons emphasize section topics and improve visual navigation.
-
How to Use
Input numerical data and text into each cell for financial reports, quarterly performance presentations, and investor briefings. Select from multiple color schemes (teal, orange, teal accent) to match brand guidelines, and easily add or remove rows to accommodate varying data sets.
-
Recommended For
CFOs and finance professionals, business report writers, investor relations specialists, quarterly and annual performance presenters, business plan and performance report authors.
-
Slide Structure
2-slide set. Each slide contains a structured data table with 5 columns (Value 1–5) and 9 rows (Visual appeal, Eye-Catching visual, Sleek diagram & chart, Contemporary colors, etc.). Left-aligned circular icons (running figure, human silhouette) with label text provide visual emphasis and section identification.
Related Products
-

Blue Line Wide Template Table1
#Financial Plans and Performance #Diagram #Sales and Revenue
-

Grain Yield Table – Financial Planning and Performance
#Financial Plans and Performance #Diagram #Sales and Revenue
-

Effective Data Table Slide – Financial Planning and Performance
#Financial Plans and Performance #Diagram #Sales and Revenue
-

Cost Table by Beans – Unique Financial Analysis
#Financial Plans and Performance #Diagram #Sales and Revenue
