THE ROAD Presentation Table & Tied Vertical Bar Graph – Market and Competitor Analysis
RJ0200032_20
- Last Update 04/06/2025
- File Size 0.5MB
- # of Slides 2
- File Format PPTX
- Slide Ratio 16:9
- Color
Keywords
- #Content-Based Slides
- #Design-Based Slides
- #Market and Competitor Analysis
- #Diagram
- #Graph
- #Future Outlook
- #Competitive Advantage
- #Table
- #Column
- #Standard Table
- #Grouped Column
- #16:9
- #grouped vertical bar chart PowerPoint
- #competitor analysis presentation slide
- #market analysis graph template
- #4-series bar chart PPT
- #data comparison slide download
About the Product
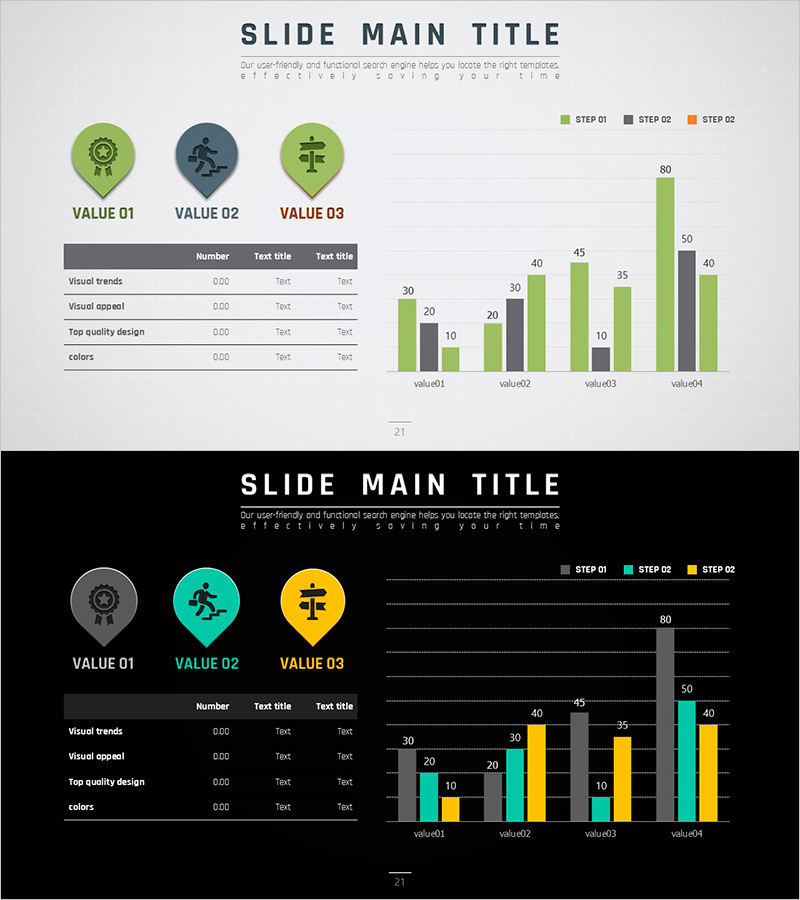
A grouped vertical bar chart PowerPoint slide designed for market and competitor analysis presentations. The slide features four data categories displayed across four series using lime green, gray, and orange colors, enabling direct comparison of competitor performance metrics, market share, and future outlook. The left side includes a data table for numerical reference, while the right side presents the grouped bar visualization for quick trend recognition. Two slide layouts are provided—light background for daytime presentations and dark background for evening sessions or online meetings, both in 16:9 widescreen format.
Usage Points
-
Main Usage
This slide compares multiple data series across four categories—such as competitor performance metrics, market share percentages, or projected growth rates. The grouped bar structure clearly shows differences between series within each category, making it ideal for executive briefings, investor presentations, and strategic planning meetings where competitive positioning must be communicated effectively.
-
How to Use
Enter category names, numerical values, and descriptions in the left table; the right graph updates automatically. Colors (lime, gray, orange) can be customized to match your corporate brand. Use the light background version for daytime presentations and printing; use the dark background for evening events and virtual meetings.
-
Recommended For
Recommended for executives, strategy teams, marketing departments, and sales teams presenting competitor analysis, market status, and performance comparisons. Particularly useful during quarterly earnings reports, new business planning, and market entry strategy sessions where multiple metrics must be compared simultaneously.
-
Slide Structure
Slide 1 (light background): Title area at top, 4-row data table on left (category, value, description), grouped vertical bar chart on right (value01–value04 with 4 series). Slide 2 (dark background): identical layout with black background, white text, and lime/orange accent colors. Legend displayed at top right with STEP 01–03 indicators.
Related Products
-

Flowering Period Graph – Future Outlook Analysis
#Market and Competitor Analysis #Graph #Future Outlook
-

Eco-friendly Icon Bar Graph Slide
#Market and Competitor Analysis #Diagram #Graph
-

Bundled Charts for Infinite Energy Analysis
#Market and Competitor Analysis #Graph #Market Status
-

Competitiveness Table and Chart Analysis – Market and Competitor Analysis
#Market and Competitor Analysis #Diagram #Graph
