Market Analysis by Year Pie Chart – Emphasizing Market Share
RJ0300018_9
- Last Update 04/22/2025
- File Size 2.6MB
- # of Slides 2
- File Format PPTX
- Slide Ratio 16:9
- Color
Keywords
About the Product
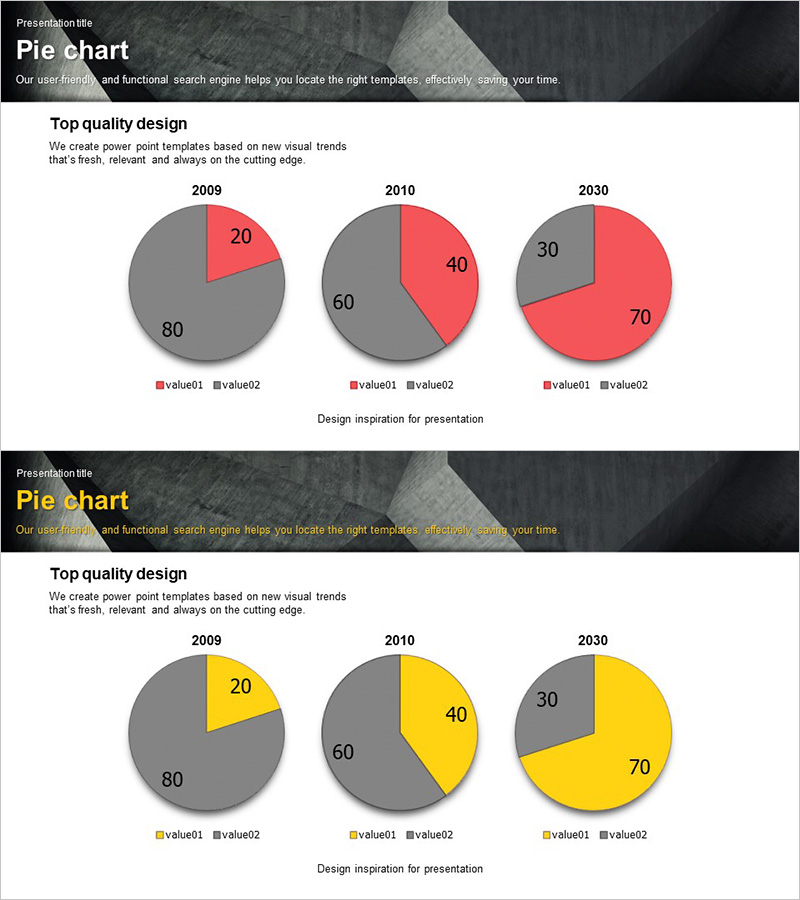
A PowerPoint pie chart slide that clearly compares market share across multiple years. This presentation template visualizes data for 2009, 2010, and 2030 using 2-segment pie charts, making market trends and shifts immediately apparent. The design uses gray backgrounds with contrasting accent colors (red/yellow) to highlight key metrics, optimized for 16:9 widescreen displays. Perfect for business presentations, marketing reports, investor pitch decks, and competitive analysis slides where market data visualization is essential.
Usage Points
-
Main Usage
Visualize year-over-year market share changes using pie charts to clearly show competitive positioning. The 2-segment structure emphasizes the proportion difference between key segments, while parallel display of three years enables quick identification of market trend shifts over time.
-
How to Use
Insert this slide into the market analysis section of marketing reports, competitive landscape slides in investor presentations, or market opportunity analysis pages in business plans. Simply edit the numbers and legend to input your actual data for immediate use. Colors can be customized to match your brand identity.
-
Recommended For
Marketing managers, business development professionals, executive report coordinators, investor relations specialists, and market research analysts presenting market share data, competitive positioning, customer segmentation, and market opportunity analysis.
-
Slide Structure
Three year-over-year pie charts (2009, 2010, 2030) with 2-segment structure each. Each chart contains two data series (value01·value02) with gray base segments and contrasting accent segments. Legend displayed below charts. Optimized for 16:9 widescreen format across 2 slides.
Related Products
-

Analysis by Pie Chart Item – Visualizing Market Share
#Market and Competitor Analysis #Graph #Market Share
-

Detailed Analysis Pie Chart – Market Share and Promising Competitors
#Market and Competitor Analysis #Graph #Market Share
-

Target Market Share Analysis – Visualizing Market Analysis with Pie Chart
#Market and Competitor Analysis #Graph #Other
-

Market Share Circle Graph – Ideal for Market Analysis
#Market and Competitor Analysis #Graph #Market Share
