Children’s Activity Preferences Comparison – Market Status and Competitive Advantage
RB0600024_7
- Last Update 03/14/2025
- File Size 0.8MB
- # of Slides 2
- File Format PPTX
- Slide Ratio 4:3
- Color
Keywords
- #Content-Based Slides
- #Design-Based Slides
- #Market and Competitor Analysis
- #Graph
- #Market Status
- #Competitive Advantage
- #Horizontal Bar
- #Horizontal Bar Chart
- #4:3
- #horizontal bar chart PowerPoint
- #data comparison slide template
- #bar graph presentation
- #numerical data visualization
- #competitive analysis slide
About the Product
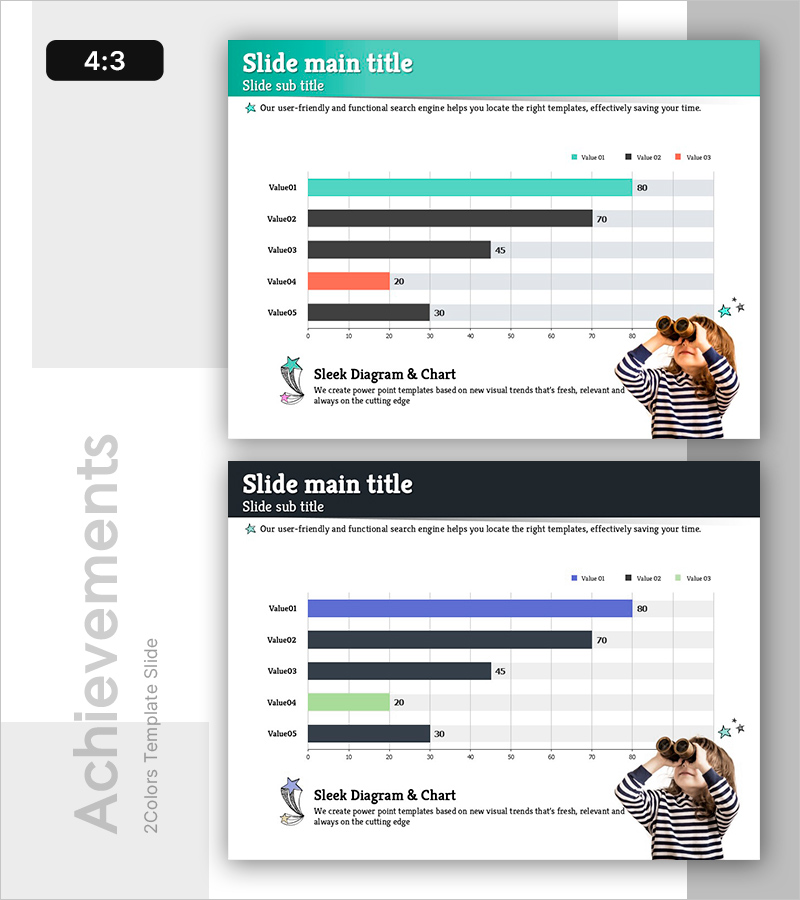
A PowerPoint slide featuring a horizontal bar chart that visualizes numerical data for five items. The chart uses a turquoise, black, and coral color palette to clearly differentiate each bar, with numerical labels displayed at the end of each bar for precise data communication. This slide is ready to use for business presentations including market analysis, preference surveys, and competitive comparisons. Provided in 4:3 aspect ratio with 2 slides, all colors and values are fully editable to match your specific data.
Usage Points
-
Main Usage
This slide presents five data items in a horizontal bar chart format, enabling quick visual comparison of relative values. It is designed for quantitative data presentations such as market status, customer preferences, competitor benchmarking, and performance metrics.
-
How to Use
Replace the five item labels (Value01–Value05) and their corresponding values (80, 70, 45, 20, 30) with your own data. The bar lengths adjust automatically, and colors can be easily modified. Add or edit the title, subtitle, and descriptive text to align with your presentation context.
-
Recommended For
Marketing managers, business analysts, strategists, and executives presenting market insights, customer preferences, sales performance, or competitive positioning. Suitable for business plans, marketing proposals, quarterly reports, and investor pitch decks.
-
Slide Structure
Turquoise header bar at the top containing title and subtitle. Central area displays five horizontal bars representing data items, color-coded in turquoise (Value01), black (Value02, Value03, Value05), and coral (Value04). Numerical labels appear at the end of each bar. Decorative illustration element positioned in the lower right corner.
Related Products
-

Meat and Vegetable Consumption by Region – Market Status Analysis
#Market and Competitor Analysis #Graph #Other
-

Eco Market Analysis Graph – Visualizing Competitive Advantage Data
#Market and Competitor Analysis #Graph #Market Status
-

Market Analysis Visualization with Horizontal Bar Chart – Emphasizing Competitive Advantage
#Market and Competitor Analysis #Graph #Market Status
-

India Travel-Related Business Overview and Market Share – Market Status Analysis
#Market and Competitor Analysis #Graph #Market Status
