India Travel-Related Business Overview and Market Share – Market Status Analysis
RJ0600023_6
- Last Update 06/27/2025
- File Size 0.8MB
- # of Slides 2
- File Format PPTX
- Slide Ratio 16:9
- Color
Keywords
- #Content-Based Slides
- #Design-Based Slides
- #Market and Competitor Analysis
- #Graph
- #Market Status
- #Competitive Advantage
- #Horizontal Bar
- #Horizontal Bar Chart
- #16:9
- #horizontal bar chart PowerPoint
- #market share analysis slide
- #India business presentation
- #data comparison chart
- #bar graph template download
About the Product
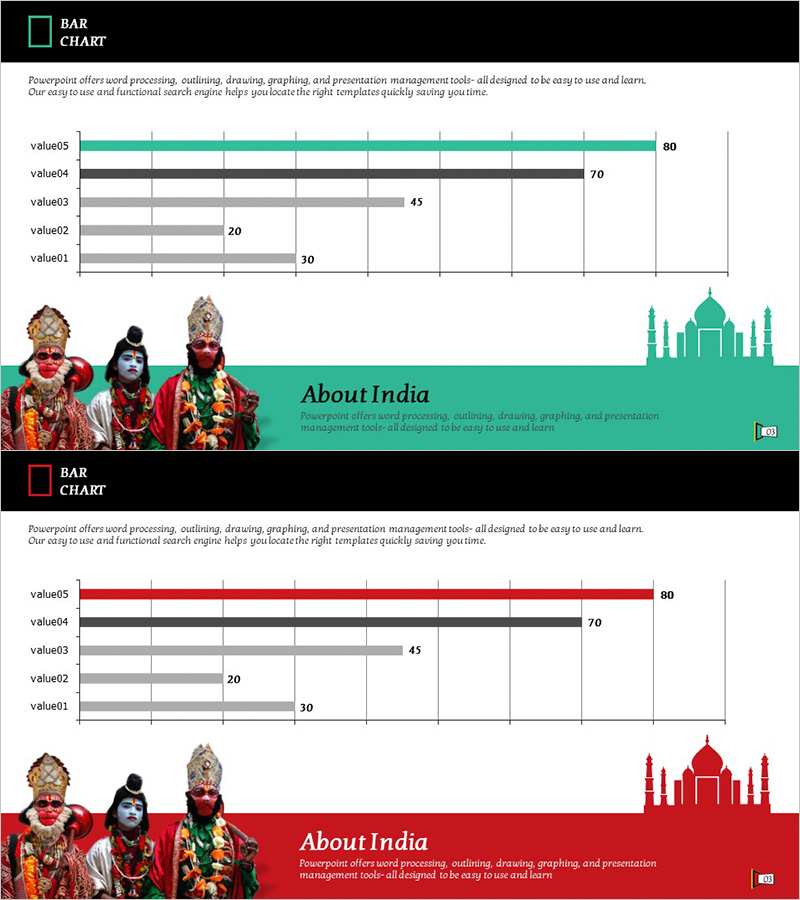
A PowerPoint slide visualizing India's travel-related business market status through a 5-item horizontal bar chart. Each item's numerical comparison and ranking are expressed intuitively, with data series differentiated by three colors: teal, black, and gray. The slide features descriptive text at the top and cultural imagery of India with a Taj Mahal silhouette at the bottom, optimized for India market analysis presentations. Available in 16:9 aspect ratio PPTX format, ready for immediate editing.
Usage Points
-
Main Usage
This slide is designed to clearly compare and communicate numerical data in India travel and business market analysis materials. The 5-item horizontal bars allow viewers to instantly grasp the magnitude differences and rankings between items, making it ideal for business overview presentations, market analysis reports, and investment pitch decks.
-
How to Use
Open the slide and replace the existing data values (80, 70, 45, 20, 30) with your actual figures. The bar lengths and numerical labels update automatically as you input new data. Colors, fonts, and background can be customized to match your company's branding guidelines.
-
Recommended For
Travel agencies and tourism companies planning India market entry, consultants and marketing professionals preparing market analysis reports, startup founders pitching for investment funding, and business school students presenting case study analyses.
-
Slide Structure
The template consists of 2 slides, each featuring a 5-item horizontal bar chart (value01 through value05). The first slide uses a teal background while the second employs a red background, offering color variations. Each bar displays its data value label on the right side, with cultural imagery and a Taj Mahal silhouette at the bottom to reinforce the India theme.
Related Products
-

Meat and Vegetable Consumption by Region – Market Status Analysis
#Market and Competitor Analysis #Graph #Other
-

Market Analysis Visualization with Horizontal Bar Chart – Emphasizing Competitive Advantage
#Market and Competitor Analysis #Graph #Market Status
-

Eco Market Analysis Graph – Visualizing Competitive Advantage Data
#Market and Competitor Analysis #Graph #Market Status
-

Children’s Activity Preferences Comparison – Market Status and Competitive Advantage
#Market and Competitor Analysis #Graph #Market Status
