Market Analysis Visualization with Horizontal Bar Chart – Emphasizing Competitive Advantage
RJ0200029_10
- Last Update 04/05/2025
- File Size 0.8MB
- # of Slides 2
- File Format PPTX
- Slide Ratio 16:9
- Color
Keywords
- #Content-Based Slides
- #Design-Based Slides
- #Market and Competitor Analysis
- #Graph
- #Market Status
- #Competitive Advantage
- #Horizontal Bar
- #Horizontal Bar Chart
- #16:9
- #horizontal bar chart PowerPoint
- #market analysis slide template
- #5-item data comparison
- #competitive advantage chart
- #bar graph presentation template
About the Product
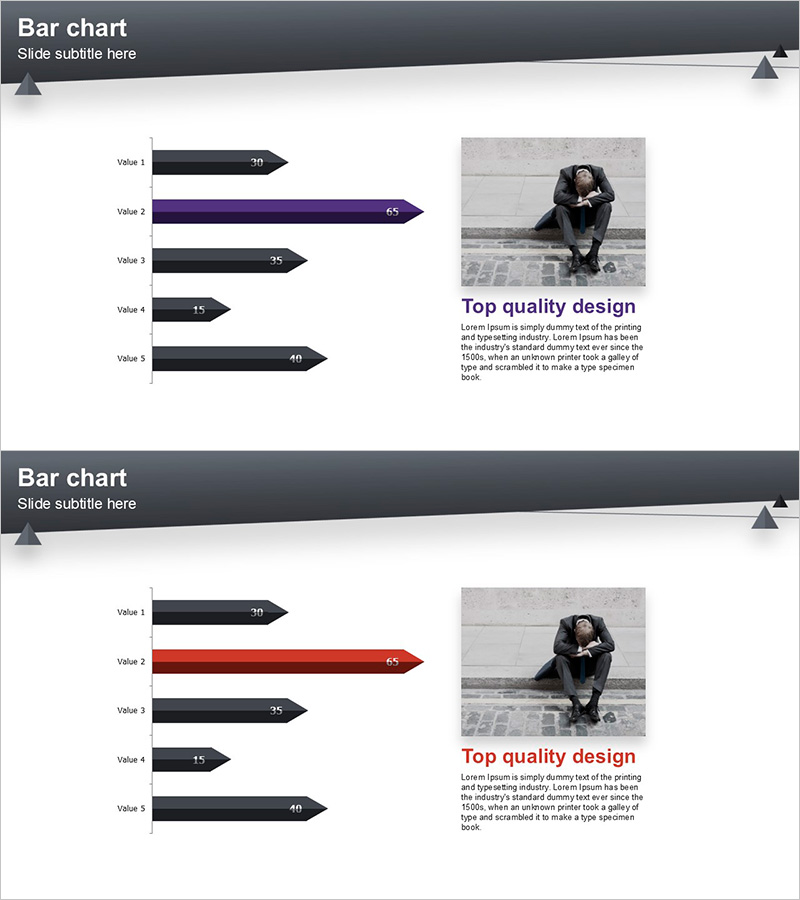
A horizontal bar chart PowerPoint slide optimized for market analysis and competitive advantage visualization. This presentation template features five data items displayed as arrow-shaped bars in dark navy, purple, and charcoal tones, clearly representing data hierarchy and rankings. Each bar includes numeric labels at the end for precise value display, making it ideal for business reports, marketing presentations, and strategic analysis decks. The 2-slide set provides flexibility for multiple data scenarios, delivered in 16:9 widescreen PPTX format for seamless integration into modern presentations.
Usage Points
-
Main Usage
Compares five data items side-by-side using horizontal bars, ideal for market share analysis, competitor benchmarking, sales performance, and customer satisfaction metrics. The arrow-shaped bars with numeric labels at the end highlight exact values, while color differentiation emphasizes the highest-performing item.
-
How to Use
Replace the default labels and numeric values with your own data to instantly customize the slide. Insert into market analysis sections, competitive positioning pages, or performance review slides to capture audience attention. Color palette can be adjusted to match corporate branding guidelines.
-
Recommended For
Marketing professionals, executives, business development teams, consultants, and data analysts presenting market insights, competitive positioning, and performance metrics. Suitable for business plans, investor pitch decks, quarterly reports, and strategic planning meetings.
-
Slide Structure
Two-slide set with identical layout featuring five horizontal bars per slide. Left side displays item labels (Value 1–5), center shows arrow-shaped bars in varying colors, right side contains numeric values, and upper right includes image and text area for supplementary information.
Related Products
-

Meat and Vegetable Consumption by Region – Market Status Analysis
#Market and Competitor Analysis #Graph #Other
-

Test Tube Bar Graph for Market Analysis – Highlighting Competitive Advantage
#Market and Competitor Analysis #Graph #Market Status
-

Eco Market Analysis Graph – Visualizing Competitive Advantage Data
#Market and Competitor Analysis #Graph #Market Status
-

India Travel-Related Business Overview and Market Share – Market Status Analysis
#Market and Competitor Analysis #Graph #Market Status
