Business Structure Diagram – Visualizing Business Areas
RM0100001_17
- Last Update 01/24/2025
- File Size 2MB
- # of Slides 2
- File Format PPTX
- Slide Ratio 16:9
- Color
Keywords
- #Content-Based Slides
- #Design-Based Slides
- #Product/Service Introduction
- #Business Introduction
- #Diagram
- #Composition
- #Business Areas
- #Cluster
- #Chain Diagram
- #16:9
- #circular diagram PowerPoint
- #4-node connection diagram
- #business structure PowerPoint slide
- #diagram PPT slide template
- #business area visualization presentation
About the Product
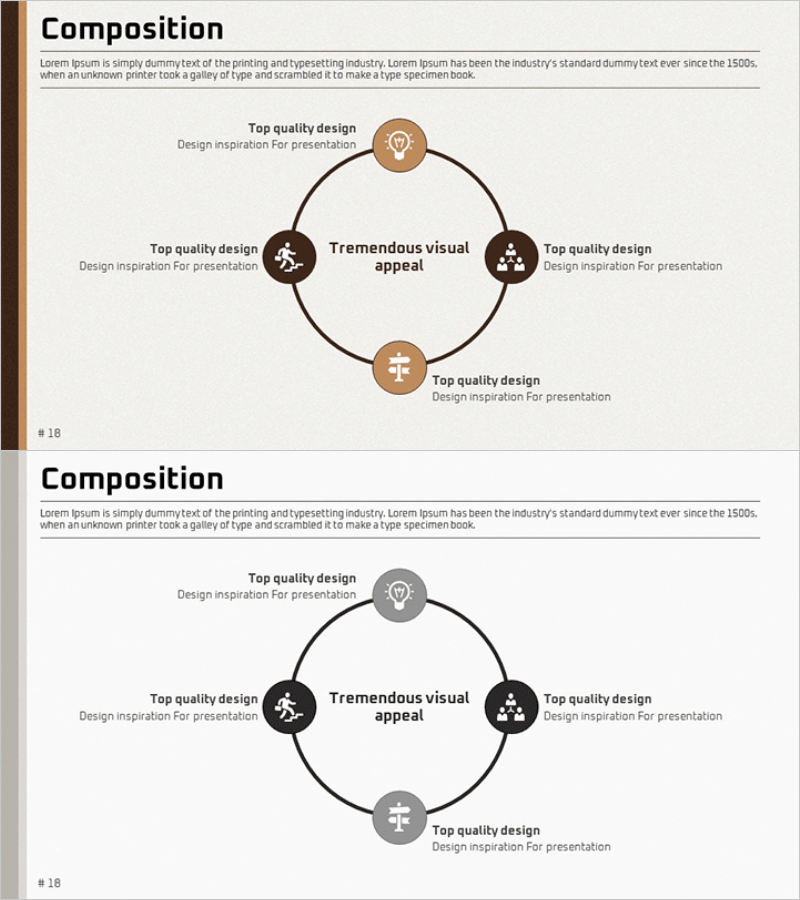
A circular diagram PowerPoint slide that visualizes a central concept through four interconnected nodes. Designed with brown and gray dual-tone colors, each node features an icon and text label for representing business areas, organizational components, core values, or strategic elements. This 2-slide set includes color variations and is optimized for 16:9 widescreen format. Perfect for presentations that require clear visualization of cyclical processes or mutually dependent concepts in business communications.
Usage Points
-
Main Usage
Represents four mutually interconnected elements in a circular structure around a central concept. Effectively visualizes business areas, organizational components, core values, or strategic factors to enhance audience comprehension and engagement.
-
How to Use
Use in company overview slides to explain business divisions, in product introduction sections to show feature interconnections, or in strategy presentations to demonstrate how elements interact. Easily customize node text and icons to match your specific content requirements.
-
Recommended For
Ideal for business strategy presentations, organizational structure explanations, product ecosystem introductions, business model descriptions, and marketing strategy briefings. Recommended for executives, marketing professionals, business development teams, and consultants presenting to stakeholders.
-
Slide Structure
Central concept text surrounded by four circular nodes positioned at top, left, right, and bottom. Each node contains an icon (lightbulb, person, group, cross) and text label, connected by black arrows in clockwise direction. The 2-slide set provides brown-tone and gray-tone color variations for design flexibility.
Related Products
-

Chemical Element Diagram – Visual Representation of Composition
#Product/Service Introduction #Business Introduction #Diagram
-

Visualizing Business Activities – Innovative Components
#Product/Service Introduction #Business Introduction #Diagram
-

Business Structure Puzzle Diagram – Presentation of Business Overview and Cluster
#Product/Service Introduction #Business Introduction #Diagram
-

Subject Learning Elements Diagram – Visualizing Business Regions and Structure
#Product/Service Introduction #Business Introduction #Diagram
