Business Structure Puzzle Diagram – Presentation of Business Overview and Cluster
RM0100007_17
- Last Update 01/26/2025
- File Size 0.5MB
- # of Slides 2
- File Format PPTX
- Slide Ratio 16:9
- Color
Keywords
About the Product
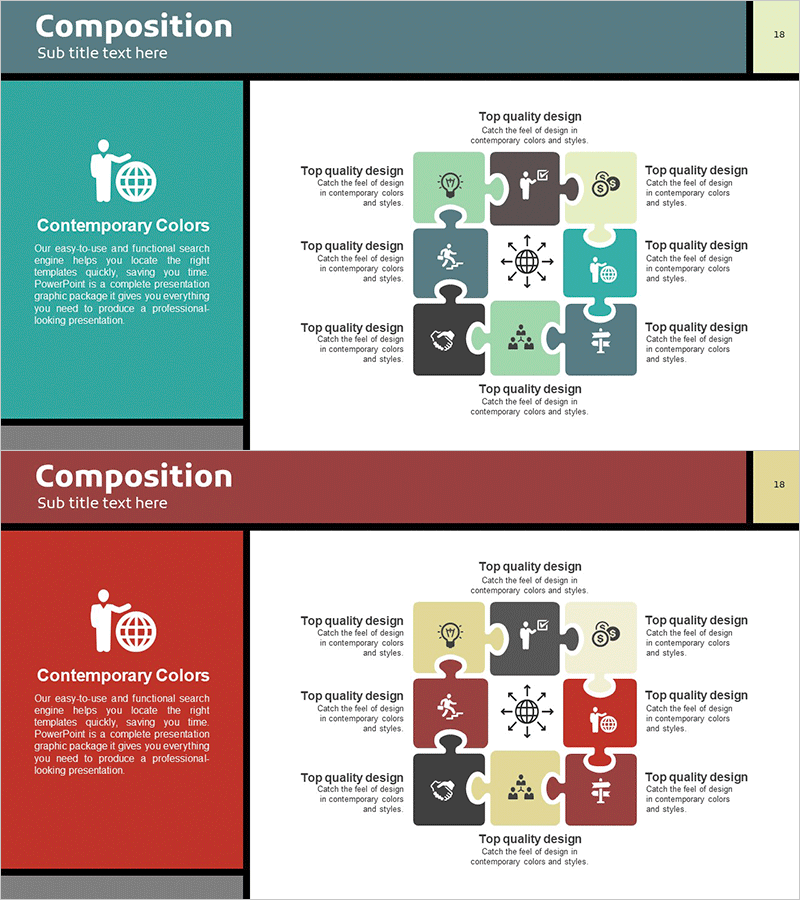
A 9-node puzzle cluster diagram PowerPoint slide that visualizes business structure and organizational relationships. The design features a central core element connected to eight surrounding nodes, creating an intuitive representation of business divisions, functions, and interdependencies. Contrasting colors—teal, red, gray, and yellow—distinguish each area and clarify information hierarchy. Business-related icons (globe, gear, people, heart, cross) reinforce the meaning of each node, making it immediately applicable to presentations, business overviews, and organizational structure explanations. The 2-slide set offers multiple color combinations for customization to match corporate branding.
Usage Points
-
Main Usage
Visualizes organizational structure, business divisions, and functional relationships using a central-hub cluster format. Ideal for company overviews, business plans, organizational restructuring presentations, and strategic planning documents where complex relationships need clear, intuitive representation.
-
How to Use
Place your core concept (company, strategy, project) in the central node and arrange related divisions, functions, or roles in the eight surrounding nodes. Customize text and icons to match your organizational context, then insert into your presentation. Color schemes can be adjusted to align with corporate brand colors.
-
Recommended For
Executives, planning teams, organizational development departments, and marketing teams explaining organizational structure, business portfolios, or strategic frameworks. Suitable for consulting reports, investor pitch decks, business diversification strategy presentations, and organizational transformation initiatives.
-
Slide Structure
2-slide set. Each slide features a 9-node cluster with one central hub node and eight connected peripheral nodes. Slide 1 uses teal, gray, and yellow color palette; Slide 2 uses red, gray, and yellow. Each node includes business-related icons and is positioned to show interconnected relationships.
Related Products
-

Subject Learning Elements Diagram – Visualizing Business Regions and Structure
#Product/Service Introduction #Business Introduction #Diagram
-

Visualizing Business Activities – Innovative Components
#Product/Service Introduction #Business Introduction #Diagram
-

Scientific Areas and Disciplines Diagram - A Visual Tool for Understanding Complexity
#Product/Service Introduction #Business Introduction #Diagram
-

Business Structure Diagram – Visualizing Business Areas
#Product/Service Introduction #Business Introduction #Diagram
