Visualizing Business Activities – Innovative Components
RM0300013_6
- Last Update 02/10/2025
- File Size 1.7MB
- # of Slides 2
- File Format PPTX
- Slide Ratio 16:9
- Color
Keywords
- #Content-Based Slides
- #Design-Based Slides
- #Product/Service Introduction
- #Business Introduction
- #Diagram
- #Composition
- #Business Areas
- #Cluster
- #Inclusive Cluster Diagram
- #Chain Diagram
- #16:9
- #central connection diagram PowerPoint
- #business activity slide template
- #4-node structure diagram
- #organizational relationship chart PPT
- #radial diagram PowerPoint download
About the Product
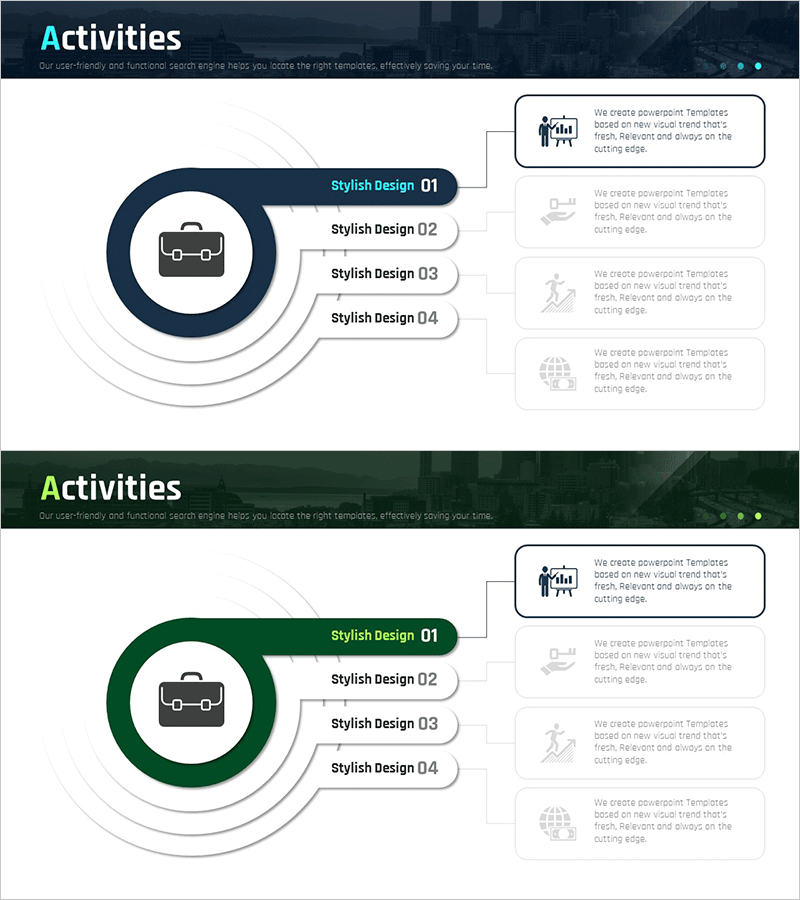
A radial connection diagram PowerPoint slide that visualizes the interconnected relationships of business activities. The design features a central dark blue circular hub with four nodes extending outward, clearly representing key organizational activities and their interactions. Each node includes an icon and text input area, with white background providing strong contrast for effective information hierarchy. This 16:9 widescreen 2-slide set is ready to use for business strategy presentations, operational planning, organizational structure explanations, and various corporate communication scenarios.
Usage Points
-
Main Usage
Designed to clearly visualize core organizational activities and their interconnected relationships at a glance. The radial node structure extending from the central hub intuitively represents business divisions, interdepartmental collaboration, process flows, and strategic initiatives, enhancing audience comprehension.
-
How to Use
Enter your organization name or core strategy in the central circular area, then populate the four nodes with key activity items (e.g., Marketing, Sales, Operations, Technology). The connecting lines and icons emphasize each activity's characteristics, and colors and text can be customized to match your presentation flow.
-
Recommended For
Ideal for executive business plan presentations, organizational restructuring explanations, interdepartmental collaboration frameworks, operational process overviews, and strategic initiative communications. Particularly effective when complex organizational relationships need to be conveyed clearly and concisely.
-
Slide Structure
Comprises 2 slides, each featuring a dark blue central circular hub (for core element input) and 4 directional nodes (for activity item input). Connection lines and icons emphasize relationships, optimized for 16:9 widescreen display format.
Related Products
-

Airplane Composition Diagram – A New Benchmark for Data Analysis
#Product/Service Introduction #Diagram #Composition
-

Scientific Areas and Disciplines Diagram - A Visual Tool for Understanding Complexity
#Product/Service Introduction #Business Introduction #Diagram
-

Business Structure Puzzle Diagram – Presentation of Business Overview and Cluster
#Product/Service Introduction #Business Introduction #Diagram
-

Slide Visualizing Business Vision and Strategy with 3 Included Components
#Product/Service Introduction #Business Vision and Strategy #Diagram
