Donut Chart of Pharmaceutical Ingredient Composition
RB0400013_5
- Last Update 03/12/2025
- File Size 0.3MB
- # of Slides 2
- File Format PPTX
- Slide Ratio 4:3
- Color
Keywords
- #Content-Based Slides
- #Design-Based Slides
- #Product/Service Introduction
- #Technical Approach
- #Graph
- #Development Status
- #Research and Development
- #Circles
- #Doughnut Chart
- #4:3
- #donut chart PowerPoint
- #pie chart slide template
- #pharmaceutical composition chart
- #ingredient ratio visualization
- #medical presentation slides
- #donut graph download
About the Product
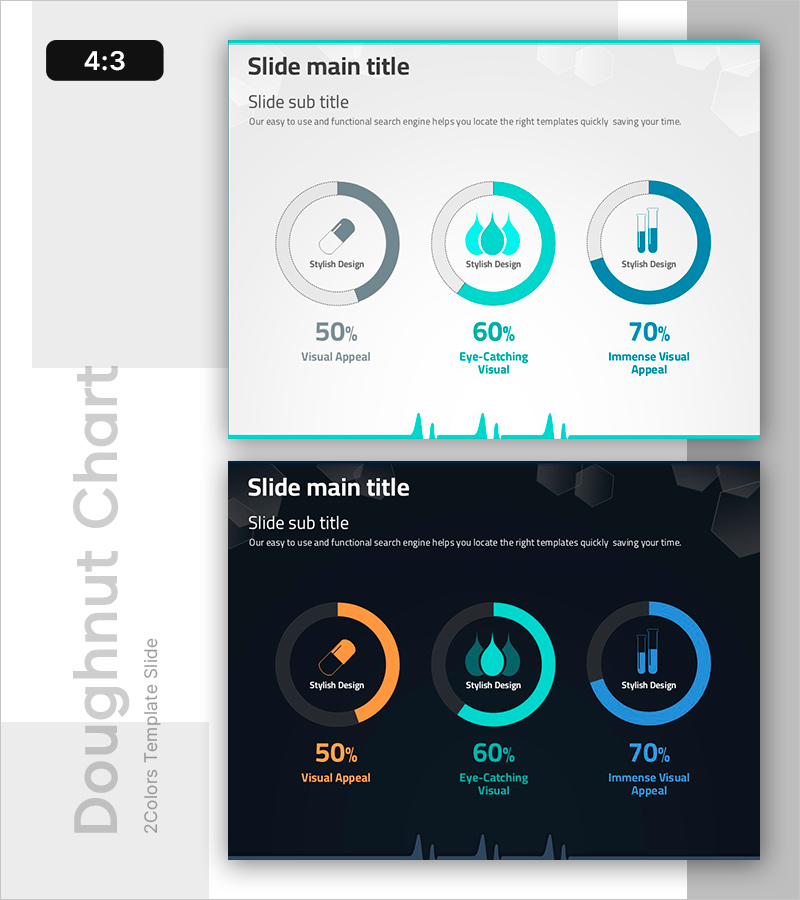
A professional PowerPoint slide featuring three donut charts designed to visualize pharmaceutical ingredient composition ratios. Available in two design versions—light background with teal and blue accents, and dark background with orange, teal, and blue tones—this slide effectively displays percentage-based data (50%, 60%, 70%) for each component. Ideal for pharmaceutical presentations, product introductions, ingredient analysis reports, and medical industry communications where clear data visualization is essential.
Usage Points
-
Main Usage
Visualize pharmaceutical and medical product ingredient composition ratios using circular donut charts, enabling audiences to quickly grasp complex percentage data. The multi-segment design allows simultaneous comparison of multiple components in a single, intuitive visual format.
-
How to Use
Deploy in pharmaceutical product launch presentations, medical institution training materials, ingredient analysis reports, and clinical research discussions. Customize each donut's color and percentage values to match your actual data, and select either the light or dark version based on your presentation environment and screen setup.
-
Recommended For
Pharmaceutical marketing professionals, product development teams, medical consultants, academic researchers, clinical trial coordinators, and healthcare educators presenting ingredient breakdowns, efficacy comparisons, and clinical data.
-
Slide Structure
Two complete slide layouts—light version (light gray background with teal and blue accents) and dark version (black background with orange, teal, and blue tones). Each slide displays three donut charts in horizontal arrangement with centered icons, percentage values, and descriptive labels positioned below each chart.
Related Products
-

Donut Chart for Comparing Research Analysis Results
#Product/Service Introduction #Technical Approach #Graph
-

Science Experiment Analysis Circle Graph Table Chart – Technological Advancement
#Product/Service Introduction #Technical Approach #Diagram
-

Light Bulb Science Donut Chart – Clarity in Information Delivery
#Product/Service Introduction #Technical Approach #Graph
-

Blue Pink Circle Graph & Table Chart – Slide Highlighting Visual Appeal
#Product/Service Introduction #Operational Plan #Technical Approach
