Bar Chart of Decline & Rise Analysis – Emphasizing Market Competitiveness
RJ0300070_13
- Last Update 05/08/2025
- File Size 0.8MB
- # of Slides 2
- File Format PPTX
- Slide Ratio 16:9
- Color
Keywords
About the Product
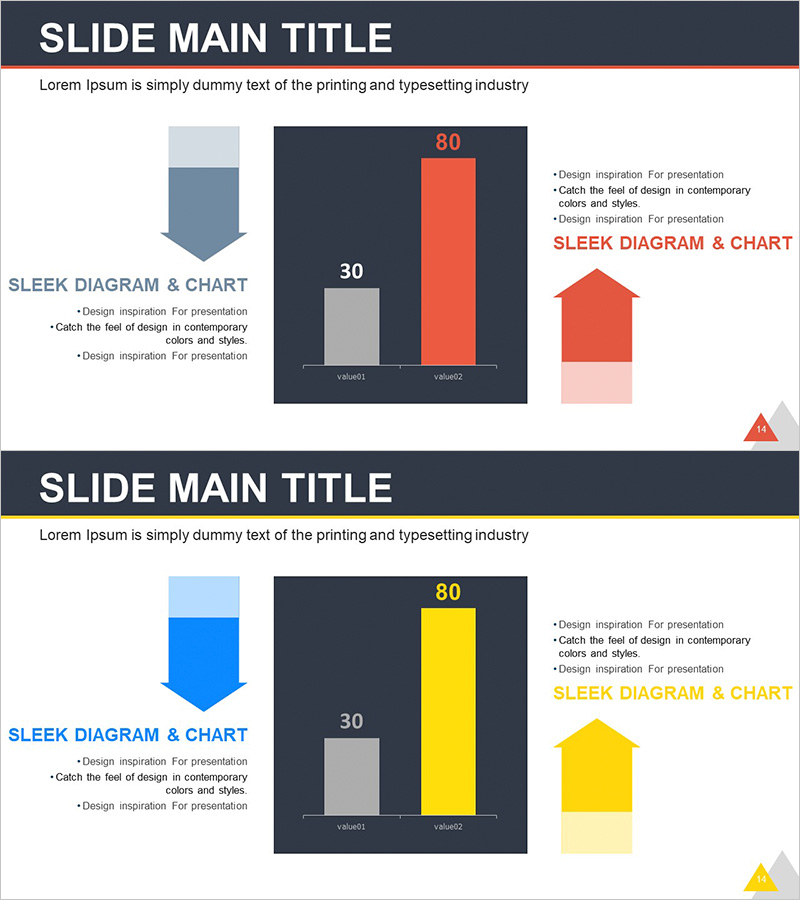
This free column chart slide is optimized for competitive analysis and market trend comparison. Featuring a dark charcoal background with red and yellow accent colors that maximize data contrast, this PowerPoint slide is ready to use—simply replace the values and labels with your own data. The layout combines a decline/rise arrow diagram on the left, a two-category column chart in the center, and a house-shaped graphic with descriptive text on the right, delivering professional visual impact. Perfect for business plans, reports, investment pitch decks, and marketing presentations. Download the free editable PPTX file and insert it directly into your presentation without additional design work. Explore more chart slide collections on GoodPello.
Usage Points
-
Main Usage
Ideal for situations requiring two data series comparison, such as competitive analysis, market trend comparison, and performance analysis in business presentations.
-
How to Use
Replace the numerical values (80, 30) and labels (value01, value02) with your own data, then update the descriptive text on the right to match your presentation content. Colors can be maintained or adjusted as needed.
-
Recommended For
Recommended for business professionals, corporate managers, and startup founders creating business plans, reports, investment pitch decks, and marketing presentations that require competitive analysis, market share comparison, or growth rate visualization.
-
Slide Structure
Single-slide design featuring a decline/rise arrow diagram on the left, a two-category column chart with two data series in the center, and a house-shaped graphic with descriptive text area on the right.
Related Products
-

Comparative Analysis Bar Graph – Market and Competitor Analysis
#Free Graphs
-

Competitive Advantage Bar General Graph – Emphasizing Performance through Market Analysis
#Free Graphs
-

Market Analysis Graph – Harmony of Pink and Bluegreen
#Free Graphs
-

Business Comparison Analysis Graph – Strengthening Market and Competitor Analysis
#Free Graphs
