Future Market Analysis Graph – Explaining the Future with Data Visualization
RJ0300092_13
- Last Update 05/15/2025
- File Size 1.1MB
- # of Slides 2
- File Format PPTX
- Slide Ratio 16:9
- Color
Keywords
About the Product
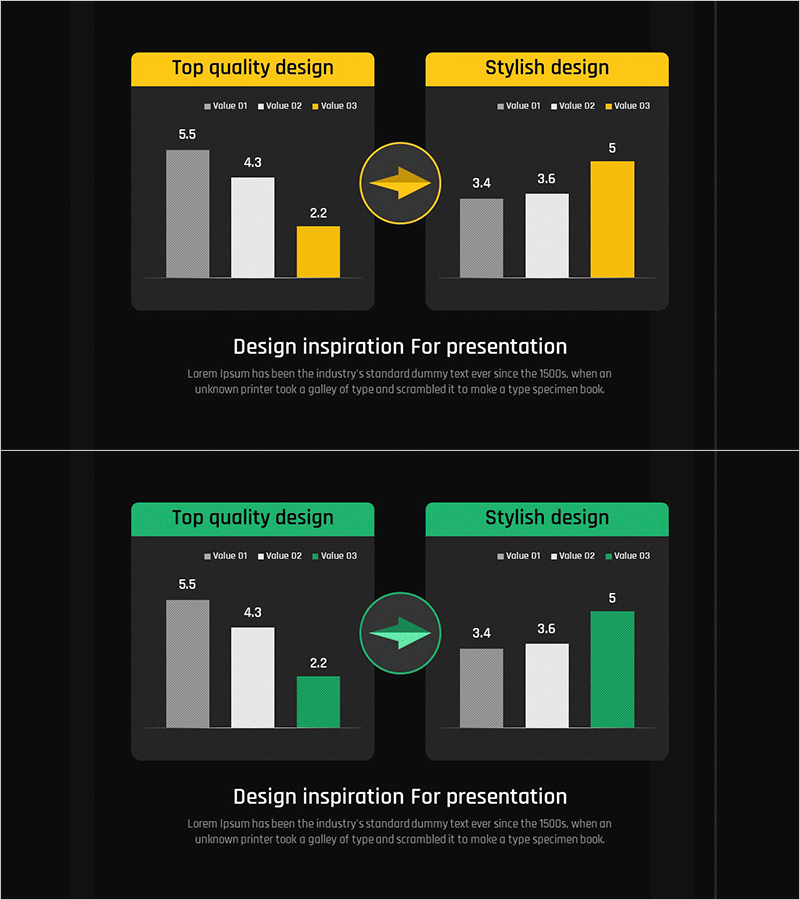
This vertical bar chart slide compares two categories side by side with a professional dark background and accent colors in yellow and green. The layout is ready to use—simply replace the chart titles, legend labels, and data values in PowerPoint to create your own comparison visualization. Perfect for business plans, marketing presentations, reports, and investor pitches. Download this free slide and customize it instantly without any design skills required. Explore more chart variations and premium graph templates in GoodPello's comprehensive slide collection.
Usage Points
-
Main Usage
Visualize and compare two categories of data side by side. The symmetric left-right layout works for A vs B comparisons, before-after analysis, strategy comparisons, or any dual-category data presentation.
-
How to Use
Replace the left and right chart titles with your comparison items, update the legend labels (Value 01/02/03) with your actual data categories, and adjust the bar heights to match your values. Edit the bottom description text as needed.
-
Recommended For
Marketing professionals, business analysts, project managers, executives, and consultants who need to present data-driven insights. Ideal for investor presentations, internal reports, client proposals, and strategic planning meetings.
-
Slide Structure
Single-slide design featuring two vertical bar charts (left and right), a central arrow icon connecting them, and descriptive text at the bottom. Each chart displays three data items (Value 01/02/03) for comparison.
Related Products
-

Comparative Analysis Bar Graph – Market and Competitor Analysis
#Free Graphs
-

Competitor Analysis and Market Trend Graph – Blue, Orange, Green Colors
#Free Graphs
-

Vertical Bar Chart for Data Analysis – Business Insights
#Free Graphs
-

Competitive Advantage Bar General Graph – Emphasizing Performance through Market Analysis
#Free Graphs
