Market Trend Analysis Graph – Visualizing Market Status
RM0100018_10
- Last Update 01/30/2025
- File Size 1MB
- # of Slides 2
- File Format PPTX
- Slide Ratio 16:9
- Color
Keywords
- #Content-Based Slides
- #Design-Based Slides
- #Market and Competitor Analysis
- #Diagram
- #Graph
- #Competitor Analysis
- #Market Analysis
- #Table
- #Line
- #Standard Table
- #Line Chart
- #16:9
- #line chart PowerPoint slide
- #market trend analysis presentation
- #data visualization template
- #trend graph PPT
- #market status slide
- #how to create line chart in PowerPoint
About the Product
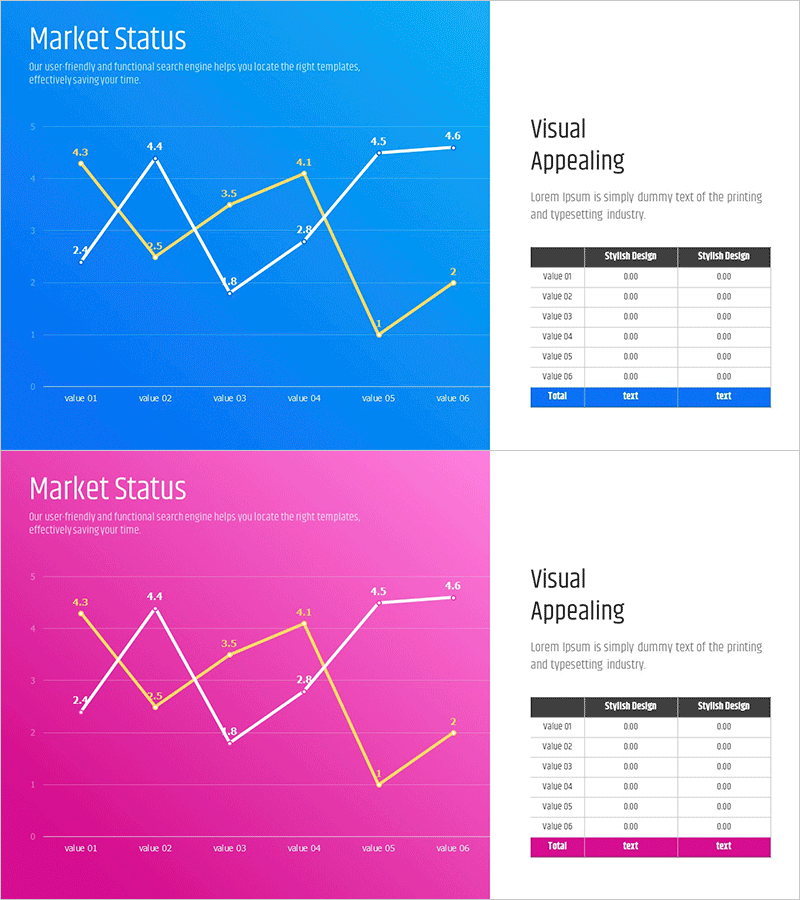
A line chart PowerPoint slide designed to visualize market status and trends over time. This presentation template features 6 data points connected by a yellow line on a bright blue background, clearly showing market fluctuations and growth patterns. The contrasting color scheme and labeled data points make numerical changes immediately apparent. Ideal for competitive analysis, sales performance tracking, market growth reporting, and business presentations. Fully editable and ready to use in reports, investor pitches, and executive briefings.
Usage Points
-
Main Usage
Displays continuous data changes such as market trends, sales performance, and growth rates using a line chart format. Enables quick trend identification and is essential for competitive analysis, market status reporting, and business performance presentations.
-
How to Use
Enter actual numerical values into the 6 data points (value 01–06) displayed on the slide, and the line chart updates automatically. Customize axis labels and legends to match your specific metrics such as market analysis, sales figures, customer satisfaction scores, or revenue trends.
-
Recommended For
Marketing managers, sales directors, business analysts, consultants, and executives preparing market analysis reports, quarterly performance reviews, investor presentations, and strategic planning meetings.
-
Slide Structure
Two-slide set featuring identical line chart layouts with different background colors (blue and pink). Each slide includes a title section, line chart area with 6 labeled data points and yellow connecting line, and a right-side text box labeled 'Visual Appealing' for additional commentary or insights.
Related Products
-

Graph Chart for Analysis Comparison – Market and Competitor Analysis
#Market and Competitor Analysis #Diagram #Graph
-

Sales and Profit Analysis Graph – Market Trends and Forecast
#Market and Competitor Analysis #Diagram #Graph
-

Target Market Trend Analysis Graph by Year – Market and Competitor Analysis
#Market and Competitor Analysis #Diagram #Graph
-

Competitor Market Analysis Table – Strategic Insights
#Market and Competitor Analysis #Diagram #Graph
