Writing Instrument Icon Horizontal Bar Chart – Market and Technology Overview
RJ0500022_7
- Last Update 06/13/2025
- File Size 3.7MB
- # of Slides 2
- File Format PPTX
- Slide Ratio 16:9
- Color
Keywords
- #Content-Based Slides
- #Design-Based Slides
- #Business Introduction
- #Market and Competitor Analysis
- #Graph
- #Technological Status
- #Competitor Analysis
- #Horizontal Bar
- #Segmented Horizontal Bar
- #16:9
- #horizontal bar chart PowerPoint
- #bar graph slide template
- #data comparison chart
- #market analysis graph
- #3-series bar chart PowerPoint
About the Product
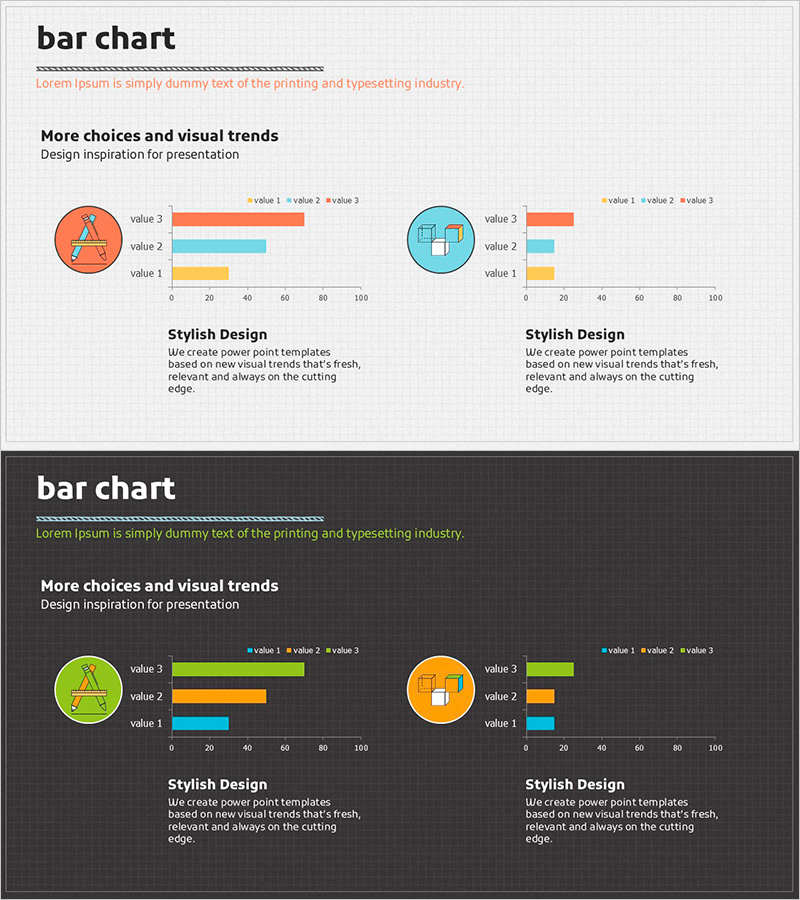
A horizontal bar chart PowerPoint slide featuring writing instrument icons for data visualization. This slide template displays three data series in orange, cyan, and yellow colors, enabling side-by-side comparison of quantitative metrics. Ideal for market analysis, technology trend reports, and competitive benchmarking presentations. The 2-slide set includes both light and dark background versions, allowing you to match your presentation theme. Fully editable PPTX format with customizable data values and labels.
Usage Points
-
Main Usage
This chart template enables comparison of three data series across multiple categories using horizontal bars. Suitable for displaying performance metrics, competitive analysis, market share data, technology benchmarks, and multi-variable trend analysis. The writing instrument icon adds thematic relevance to education, publishing, and office supply industry presentations.
-
How to Use
Adjust bar lengths to input your actual data values. Modify the legend labels (value 1, 2, 3) to match your categories. Replace the icon with alternative images if needed. Use the light background for bright venues and the dark background for dimly lit presentation spaces.
-
Recommended For
Marketing professionals, business analysts, sales executives, and project managers presenting market research, competitive analysis, quarterly reports, and business proposals. Particularly effective for education, publishing, and office supply industry presentations requiring data-driven insights.
-
Slide Structure
Two-slide template with identical chart layouts in light gray and dark charcoal backgrounds. Each slide features two circular icons (orange and cyan) paired with three horizontal bar series (orange, cyan, yellow) representing three data categories. Includes a 0-100 numerical axis for scale reference.
Related Products
-

Comparison Bar Graph of Two Topics – Essential Template for Market Analysis
#Market and Competitor Analysis #Graph #Competitor Analysis
-

Business Technology Status Bar Graph – Insights Delivered Through Data Visualization
#Product/Service Introduction #Business Introduction #Graph
-

Global Business Analysis Graph – Market and Competitor Analysis
#Market and Competitor Analysis #Graph #Competitor Analysis
-

Content Composition Breakdown by Year with Horizontal Bar Chart
#Business Introduction #Market and Competitor Analysis #Graph
