Development Status Analysis Chart - Visualization for Effective Market Analysis
RM0300018_7
- Last Update 02/12/2025
- File Size 0.8MB
- # of Slides 2
- File Format PPTX
- Slide Ratio 16:9
- Color
Keywords
- #Content-Based Slides
- #Design-Based Slides
- #Product/Service Introduction
- #Market and Competitor Analysis
- #Diagram
- #Graph
- #Development Status
- #Market Analysis
- #Table
- #Circles
- #Standard Table
- #Doughnut Chart
- #16:9
- #donut chart PowerPoint slide
- #pie chart presentation template
- #ratio analysis diagram
- #circular graph slides
- #market analysis PowerPoint
- #donut chart download
About the Product
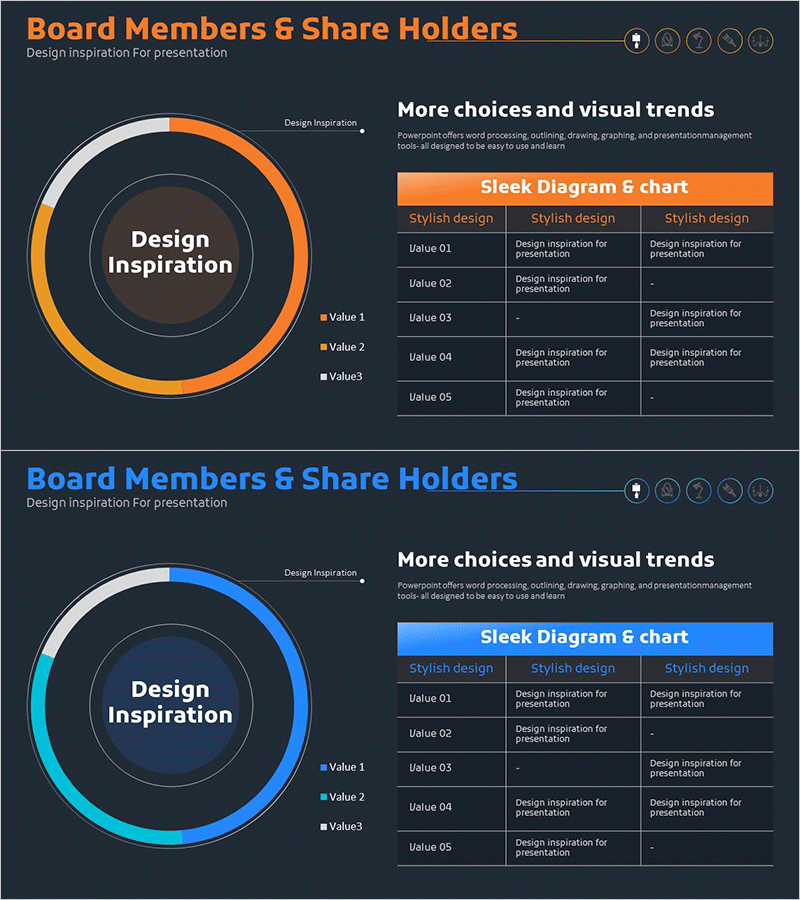
A donut chart PowerPoint slide designed for visualizing development status and market analysis data. The design features a central circular area for key messaging surrounded by a donut-shaped outer ring divided into 3 segments to represent proportional data. The color scheme includes orange, blue, and dark gray tones with legend indicators for each value. Two slide variations are provided—one in orange and one in blue—allowing you to match your presentation theme and brand colors. Delivered in 16:9 widescreen PPTX format with fully editable elements, this template is ideal for marketing analysis presentations, business status reports, investor pitch decks, and quarterly performance reviews.
Usage Points
-
Main Usage
Effectively visualize proportional data such as development progress, market share, and business performance using a donut chart format. The central circular area emphasizes key messages or critical metrics, while the outer donut segments display three data categories as percentages. This layout enhances data credibility in executive briefings, investor presentations, and strategic planning sessions.
-
How to Use
Input your actual data values into the Value 1, 2, and 3 fields, and the donut segments automatically adjust to reflect the correct proportions. Replace the central 'Design Inspiration' text with your presentation topic or core message. Update the legend item names to match your data categories. Select either the orange or blue color version based on your presentation's visual identity and branding guidelines.
-
Recommended For
Ideal for executives, finance teams, marketing departments, and business development professionals presenting quarterly or annual performance analyses. Suitable for investor relations meetings, shareholder assemblies, C-suite briefings, and client proposal presentations where data-driven decision-making and professional credibility are essential.
-
Slide Structure
Two-slide set featuring an orange-toned donut chart on the first slide and a blue-toned donut chart on the second. Each slide layout includes a donut chart on the left with a central circular messaging area, and a right-side section titled 'More choices and visual trends' with a style options comparison table. The donut ring is divided into 3 segments with corresponding legend and data labels.
Related Products
-

Mobile Development Status Analysis Graph – Market Analysis and Competitiveness
#Product/Service Introduction #Market and Competitor Analysis #Diagram
-

Shareholder Status Analysis with Pie Charts and Graphs
#Company Introduction #Market and Competitor Analysis #Diagram
-

Visualizing Board Members and Shareholders with a Sleek Diagram
#Company Introduction #Market and Competitor Analysis #Diagram
-

Type Comparison Analysis Graph & Table – Effective Tool for Market Analysis
#Market and Competitor Analysis #Diagram #Graph
