Real Estate Marketing System Diagram – Visualizing Strategic Flow
RJ0900012_11
- Last Update 08/19/2025
- File Size 0.1MB
- # of Slides 2
- File Format PPTX
- Slide Ratio 16:9
- Color
Keywords
- #Content-Based Slides
- #Design-Based Slides
- #Operational Plan
- #Marketing Plan and Strategy
- #Diagram
- #Business Processes
- #Marketing Strategy
- #Flow
- #Linear Flow
- #16:9
- #circular diagram PowerPoint
- #real estate marketing diagram
- #workflow PowerPoint slide
- #5-step cycle diagram
- #marketing process visualization
- #business operations diagram
About the Product
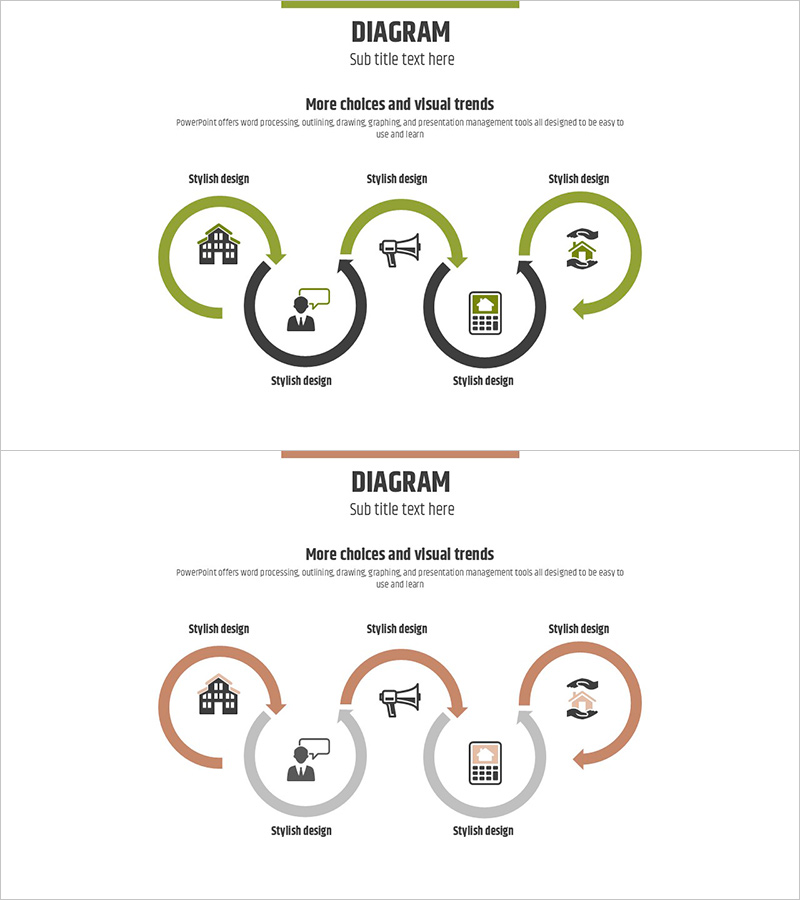
A PowerPoint slide visualizing real estate marketing operations through a 5-step circular diagram. Building, marketing, personnel, finance, and management icons form a circular flow around a central node, connected by olive green and charcoal gray two-tone arrows that clarify relationships between stages. The 2-slide set includes an olive green version and a coral tone version, allowing you to match your presentation's color scheme. Ideal for explaining workflow and interdependencies in marketing strategy, operational planning, and process management sections.
Usage Points
-
Main Usage
Designed to help stakeholders understand real estate marketing operations and interdependencies between stages at a glance. Five core elements—building, marketing, personnel, finance, and management—connect in a circular structure to emphasize integrated operational systems.
-
How to Use
Use in company profile presentations (operational planning section), marketing strategy documents (strategy development portion), and business reports (process explanation slides). Customize node text and icons to match your organization's specific workflow and departments.
-
Recommended For
Real estate and construction professionals, marketing department managers, business strategy planners, executives preparing reports, and anyone needing to explain organizational structure or operational processes.
-
Slide Structure
2-slide set. Each slide features a central node with 5 outer nodes arranged in a circular pattern, connected by bold arrows showing clockwise flow. First slide uses olive green tones; second slide features coral tones for color variation.
Related Products
-

Linear Diagram Visualizing Big Data Development Process
#Operational Plan #Marketing Plan and Strategy #Diagram
-

Startup Business Process - Efficient Operations and Strategies
#Operational Plan #Marketing Plan and Strategy #Diagram
-

Goals and Directions Diagram – Core of Marketing Strategy
#Marketing Plan and Strategy #Diagram #Marketing Strategy
-

Investment Process Diagram – Visualization of Business Strategy
#Business Strategy #Operational Plan #Diagram
