Customer Rating Percentage Infographic Chart for Programs
RJ0600074_12
- Last Update 07/09/2025
- File Size 3.5MB
- # of Slides 2
- File Format PPTX
- Slide Ratio 16:9
- Color
Keywords
- #Content-Based Slides
- #Design-Based Slides
- #Product/Service Introduction
- #Market and Competitor Analysis
- #Graph
- #Other
- #Development Status
- #Market Status
- #16:9
- #customer rating infographic PowerPoint
- #percentage comparison slide
- #tree icon chart
- #customer satisfaction presentation
- #market analysis infographic
About the Product
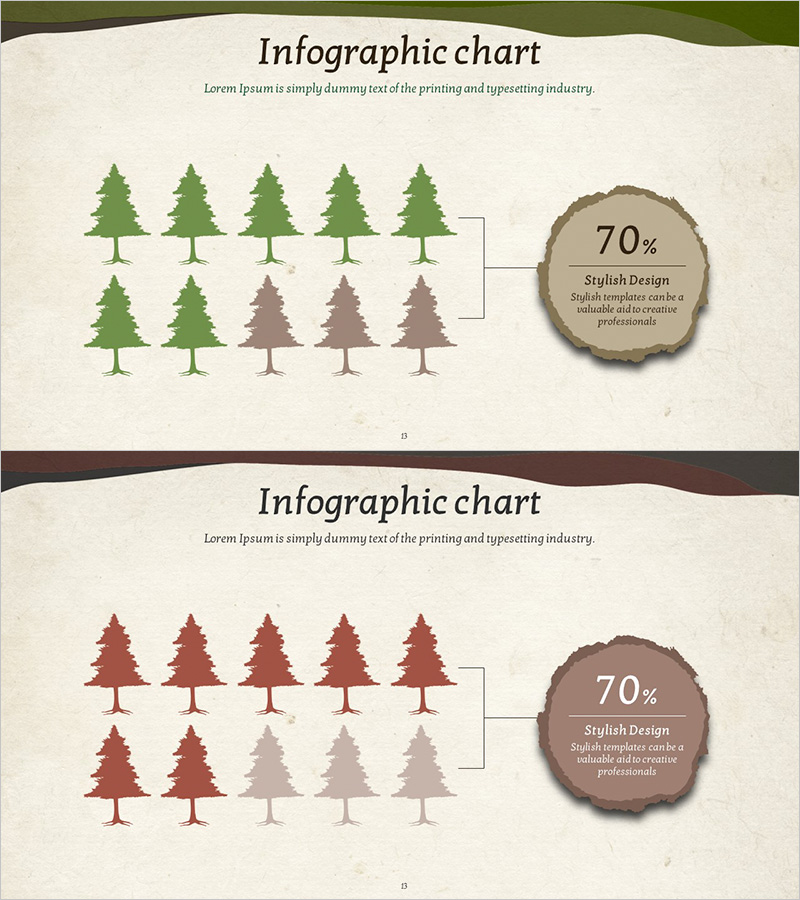
A 2-slide infographic PowerPoint presentation that visualizes customer satisfaction and evaluation ratios using tree icons in a comparative layout. The design features a cream background with green and brown tree icons paired with circular percentage badges, enhancing data readability. Each slide displays 10 tree icons arranged in two rows with color gradation to represent different satisfaction levels. Perfect for market analysis, competitive analysis, and customer feedback presentations. Fully editable PPTX format with customizable text fields for program names and percentage values.
Usage Points
-
Main Usage
Displays customer evaluation data and satisfaction ratios in a single visual comparison. The tree icon color gradation intuitively distinguishes satisfaction levels while the circular percentage badges provide quantitative credibility. Ideal for highlighting program performance differences and supporting data-driven decision-making in business presentations.
-
How to Use
Use in market analysis sections when comparing customer satisfaction against competitors. Applicable to product evaluation reports, customer feedback analysis, and business performance presentations. Simply input actual program names and evaluation percentages into the text fields to create presentation-ready slides instantly.
-
Recommended For
Marketing managers, business planning teams, customer satisfaction researchers, and executives preparing performance reports. Suitable for new product launch presentations, customer satisfaction improvement planning, competitive analysis reports, and quarterly business performance reviews.
-
Slide Structure
2-slide set with each slide containing 10 tree icons (5 top row, 5 bottom row) and 1 circular percentage badge. Icon colors differentiate satisfaction levels with darker tones indicating higher ratings and lighter tones indicating lower ratings. Three editable text areas per slide: title, description, and percentage value.
Related Products
-

Business Market Status Analysis Chart – Competitive Statistics
#Product/Service Introduction #Market and Competitor Analysis #Graph
-

Vertical Bar Graph for U.S. Market Analysis by Region – Sea Lighthouse
#Market and Competitor Analysis #Graph #Other
-

Carbon Neutral Infographic Eco-Friendly Battery Chart – Modern Technology and Sustainability
#Product/Service Introduction #Business Introduction #Graph
-

Market Analysis Donut Slide for Restaurant Tour Countries
#Market and Competitor Analysis #Graph #Other
