Blue Green Broken Line Graph – Competitor Analysis
RJ0700028_10
- Last Update 07/30/2025
- File Size 0.5MB
- # of Slides 2
- File Format PPTX
- Slide Ratio 16:9
- Color
Keywords
About the Product
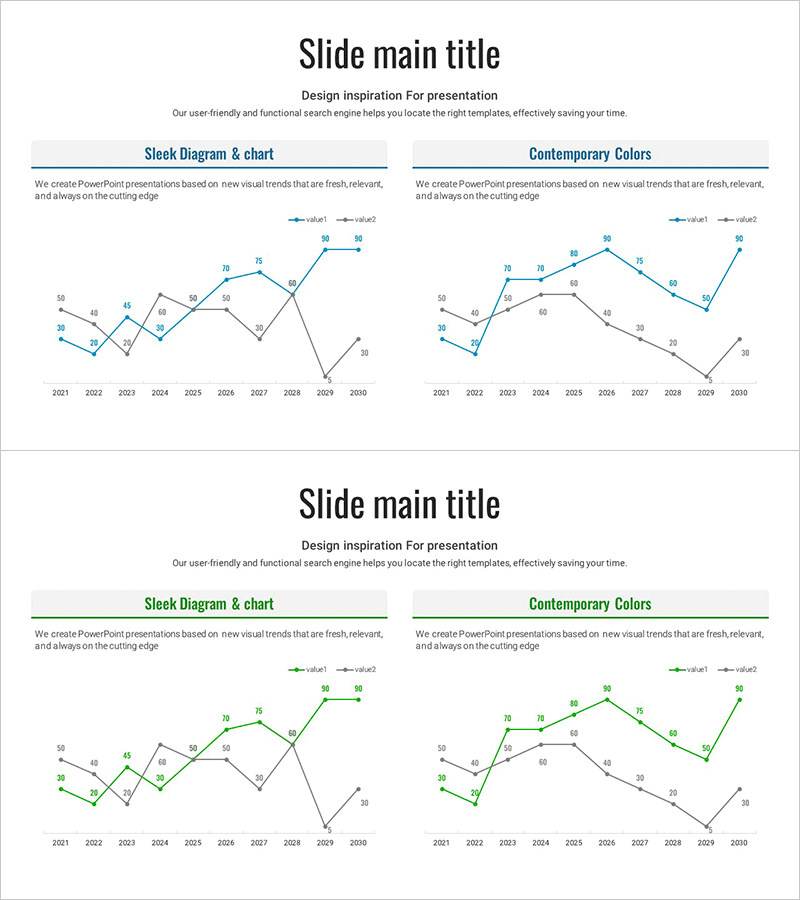
A dual-series line chart PowerPoint slide optimized for competitive performance comparison and trend analysis. The blue and green color scheme creates clear visual contrast between two companies or products, displaying data changes across a 10-year period from 2021 to 2030. Each slide is designed in 16:9 widescreen format for modern presentation environments and provided in fully editable PPTX format. Ideal for market analysis presentations, executive reports, investor pitch decks, and strategic planning sessions where quantitative comparison is essential.
Usage Points
-
Main Usage
Visualize and compare performance trends of two companies or products over time. Effectively communicate competitive positioning, market share evolution, revenue progression, and strategic performance metrics in executive and investor presentations.
-
How to Use
Open the slide and replace existing data values with your own figures. Update the legend labels (value1, value2) to company or product names, then input your year-by-year data. The chart automatically recalculates and updates. Color customization is straightforward through PowerPoint's chart formatting tools.
-
Recommended For
Executive dashboards, investor relations presentations, quarterly business reviews, competitive benchmarking sessions, market analysis reports, and strategic planning meetings. Perfect for B2B presentations requiring performance comparison, market penetration analysis, and trend forecasting.
-
Slide Structure
2-slide set. Each slide contains a title section, descriptive text box, and dual-series line chart. The chart includes X-axis (2021-2030 years), Y-axis (0-80 scale), two data series (blue and green lines), data point markers, and legend.
Related Products
-

Market Insights Through Competition Analysis Chart – Gaining Competitive Edge
#Market and Competitor Analysis #Graph #Competitor Analysis
-

Visualizing Market Analysis with Line Chart – Harmony of Mint and Orange
#Market and Competitor Analysis #Diagram #Graph
-

Annual Investment Analysis Graph – Competitor Analysis and Cluster Visualization
#Market and Competitor Analysis #Diagram #Graph
-

Fantastic Wide PowerPoint Line Chart – Ideal for Market Analysis
#Market and Competitor Analysis #Graph #Competitor Analysis
