Neon Tone Competitor Analysis Broken Line Graph
RJ0300049_6
- Last Update 05/01/2025
- File Size 1.6MB
- # of Slides 2
- File Format PPTX
- Slide Ratio 16:9
- Color
Keywords
- #Content-Based Slides
- #Design-Based Slides
- #Market and Competitor Analysis
- #Graph
- #Competitor Analysis
- #Competitive Advantage
- #Line
- #Line Chart
- #16:9
- #line chart PowerPoint
- #competitor analysis slide
- #market analysis presentation
- #dual-series line graph
- #business data visualization
- #how to create line chart in PowerPoint
About the Product
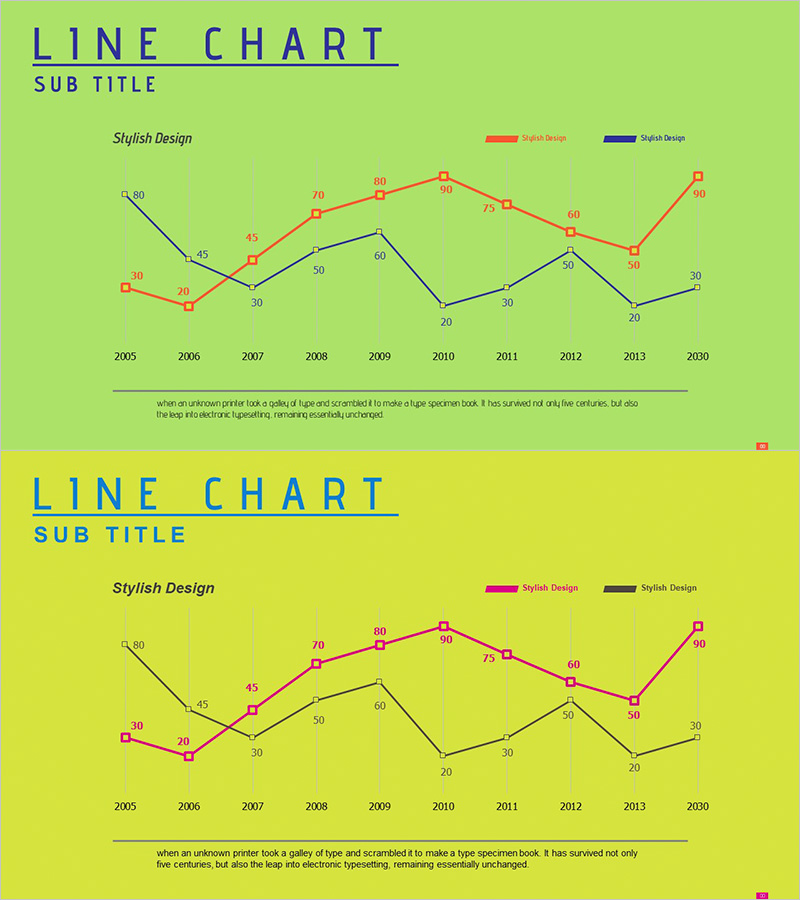
A dual-series line chart PowerPoint slide optimized for competitor analysis and market trend comparison. Set against lime and yellow backgrounds, the red and blue line series create strong visual contrast to highlight diverging data streams. Tracks 15 years of change from 2005 to 2030 with precise data point labels at each interval. Includes legend, subtitle, and descriptive text areas for immediate context in presentations. The 16:9 widescreen format across 2 slides is ready to use in executive reports, strategy meetings, and marketing presentations without additional editing.
Usage Points
-
Main Usage
Compare competitor performance metrics against your own using two line series to reveal market position and trend shifts at a glance. Emphasizes long-term data patterns (5+ years) and communicates competitive advantage or improvement opportunities clearly to executives, investors, and team members.
-
How to Use
Deploy in management reports' market analysis sections, strategy meeting decks, and investor pitch presentations to explain competitive performance trends. The bright lime and yellow background draws attention, while the red-blue line intersection points highlight reversals, convergence, and divergence to surface key insights.
-
Recommended For
Ideal for executives, business development teams, marketing teams, and strategic planning departments during quarterly and annual performance review meetings. Most effective when comparing time-series data across two entities (your company vs. competitors, Product A vs. Product B) such as market share, customer satisfaction, revenue, or website traffic.
-
Slide Structure
2-slide set. Each slide displays 15 data points (2005–2030) across two series (red and blue lines) with numeric labels at each point (range 30–90). Includes legend, subtitle, and text area for adding presentation context and analysis notes.
Related Products
-

Dawn City Theme Competitor Analysis Graph – Understanding Market Trends
#Market and Competitor Analysis #Diagram #Graph
-

Default Line Graph for Market & Competitor Analysis – Competitive Advantage
#Market and Competitor Analysis #Graph #Competitor Analysis
-

Variation Graph for the Line Chart – Optimized Design for Market and Competitor Analysis
#Market and Competitor Analysis #Graph #Competitor Analysis
-

Competitor Comparison Analysis Graph - Highlighting Competitive Advantage
#Market and Competitor Analysis #Graph #Competitor Analysis
