Competition Graphs and Analysis – Slides for Market Advantage
RJ0900024_13
- Last Update 08/23/2025
- File Size 0.3MB
- # of Slides 2
- File Format PPTX
- Slide Ratio 16:9
- Color
Keywords
- #Content-Based Slides
- #Design-Based Slides
- #Market and Competitor Analysis
- #Graph
- #Competitor Analysis
- #Competitive Advantage
- #Line
- #Line Chart
- #16:9
- #line chart PowerPoint slide
- #multi-series trend analysis
- #competitive analysis graph
- #market comparison chart
- #data visualization slides
- #business performance tracking PowerPoint
About the Product
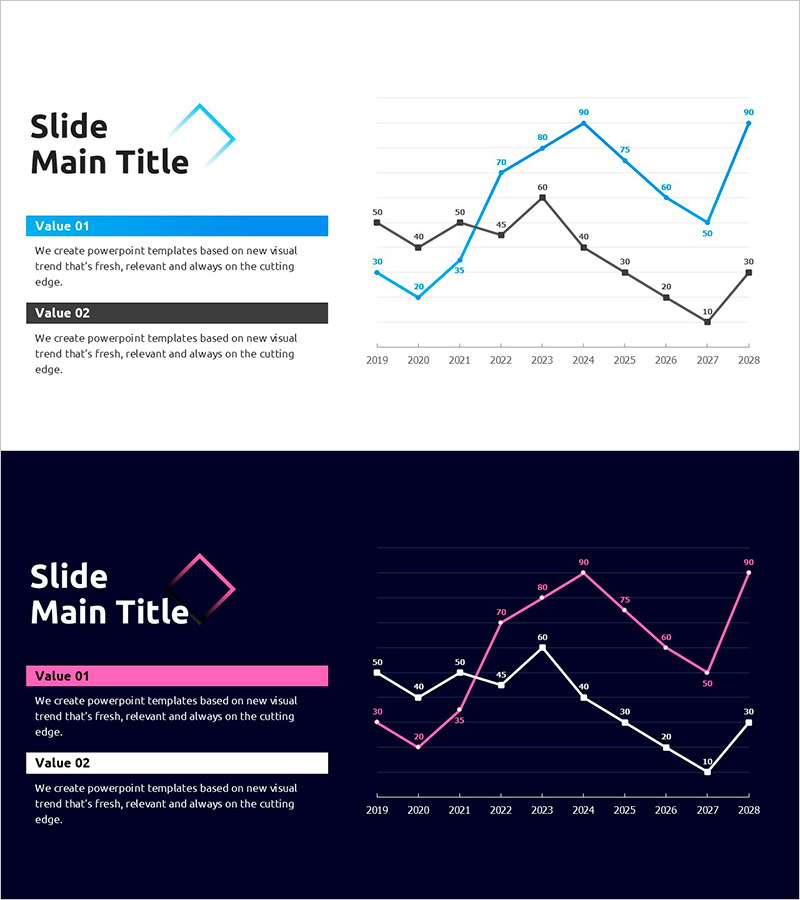
A multi-series line chart PowerPoint slide designed for competitive analysis and market positioning. This presentation template visualizes 10-year data trends (2019–2028) across three data series in blue, black, and gray, enabling clear comparison of competitive relationships and performance trajectories. The left side features Value 01 and Value 02 text boxes to highlight key insights. Two design versions are provided: a light background for standard meeting rooms and a dark background for premium presentation environments. The 16:9 widescreen format includes 2 fully editable slides ready for immediate use.
Usage Points
-
Main Usage
Visualize competitive performance trajectories and market position shifts over time. Display multiple competitors' metrics simultaneously to reveal relative standing and trend patterns at a glance. Ideal for investor presentations, executive briefings, and strategic planning sessions requiring objective market assessment.
-
How to Use
Replace the text boxes on the left with your data series labels (e.g., Your Company, Competitor A, Competitor B). Update the graph data points with actual figures and adjust line colors to match your corporate branding. Choose the light background for standard conference settings or the dark background for high-impact presentations.
-
Recommended For
Executives, strategy teams, marketing departments, and sales teams presenting competitive analysis findings. Suitable for business plans, investor pitch decks, quarterly performance reports, and market analysis documents. Commonly used by consulting firms, financial institutions, and manufacturing companies for competitive positioning presentations.
-
Slide Structure
Each slide features a left-side title area with a directional arrow icon, two text boxes (Value 01 and Value 02) for key points, and a right-side multi-series line chart. The chart displays a 2019–2028 timeline on the X-axis, 0–90 scale on the Y-axis, with three intersecting trend lines and numeric labels at each data point. Both light and dark background versions are included.
Related Products
-

Competitor Idea Analysis Graph
#Market and Competitor Analysis #Graph #Competitor Analysis
-

VR Business Market Analysis Broken Line Graph – Competitive Advantage and Trend Analysis
#Market and Competitor Analysis #Graph #Competitor Analysis
-

Competitor Analysis Comparison Graph – Visualizing Market Shares
#Market and Competitor Analysis #Graph #Competitor Analysis
-

Comparative Analysis Line Graph – Market & Competitor Analysis
#Market and Competitor Analysis #Graph #Competitor Analysis
