Paper Theme Key Financial Indicators Slide
RJ0300048_17
- Last Update 05/01/2025
- File Size 6.1MB
- # of Slides 2
- File Format PPTX
- Slide Ratio 16:9
- Color
Keywords
- #Content-Based Slides
- #Design-Based Slides
- #Financial Plans and Performance
- #Diagram
- #Income Statement
- #Key Financial Indicators
- #Table
- #Standard Table
- #16:9
- #financial indicators table PowerPoint
- #financial metrics slide
- #income statement table
- #financial comparison slide
- #table PowerPoint template
About the Product
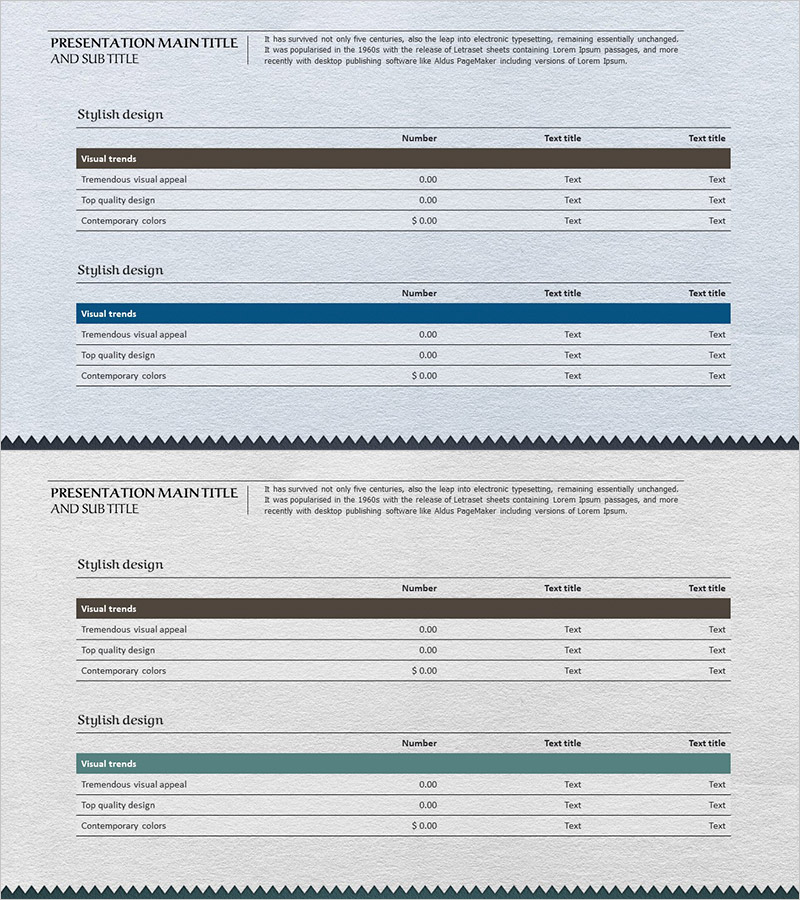
A PowerPoint slide featuring a 3-column table structure designed to present financial performance data clearly. Built on a paper texture background with charcoal headers and light gray rows, this presentation slide is ideal for displaying financial metrics, income statements, and key performance indicators side by side. Each cell is fully editable for numbers and text, making it ready to use immediately in reports and presentation decks.
Usage Points
-
Main Usage
Present financial performance, income statements, and key financial metrics in a structured, comparable format. The 3-column table layout enables clear visualization of period-over-period, category-by-category, or department-by-department financial data, supporting credible information delivery in reports and presentations.
-
How to Use
Input financial line items, numerical values, and percentages into each cell to create income statements or financial analysis materials. The paper texture background maintains consistency with printed documents, while the charcoal header emphasizes key items. Colors and fonts are fully customizable to match corporate branding.
-
Recommended For
Ideal for CFOs, finance managers, executives, and investor presentations. Effective in quarterly financial reports, annual business performance presentations, investor pitch decks, and financial analysis reports where data credibility is essential.
-
Slide Structure
Two-slide set with the first slide featuring a charcoal header and light gray 3-column table, and the second slide featuring a dark brown header and light beige 3-column table. Each table accommodates 3–5 rows for entering financial line items and corresponding values.
Related Products
-

Income Statement Table – Clearly Presenting Financial Plans and Performance
#Financial Plans and Performance #Diagram #Income Statement
-

Insight Summary Table – Visualizing Financial Plans and Performance
#Financial Plans and Performance #Diagram #Income Statement
-

Leather Material Presentation Template Table Chart – Financial Performance Visualization
#Financial Plans and Performance #Diagram #Income Statement
-

Key Financial Indicators Table – Effective Data Presentation
#Financial Plans and Performance #Diagram #Income Statement
