Key Financial Indicators Table – Clear Profit Analysis
RJ0300046_12
- Last Update 04/30/2025
- File Size 3.4MB
- # of Slides 2
- File Format PPTX
- Slide Ratio 16:9
- Color
Keywords
- #Content-Based Slides
- #Design-Based Slides
- #Financial Plans and Performance
- #Diagram
- #Income Statement
- #Key Financial Indicators
- #Table
- #Standard Table
- #16:9
- #financial indicators table PowerPoint
- #profit analysis slide template
- #financial planning table PPT
- #comparison analysis presentation
- #financial performance table slide
About the Product
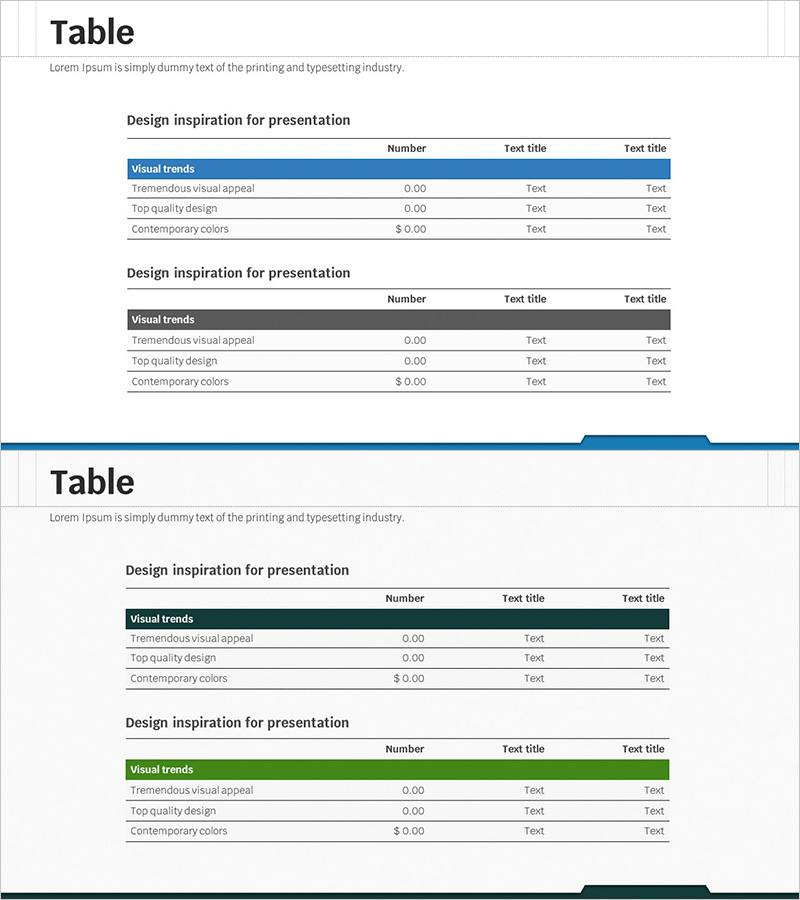
A 3-row structured table PowerPoint slide designed to clearly present financial performance and profit analysis. This presentation template organizes key financial indicators, income statements, and financial planning data in a row-by-row comparison format. The header row features blue, gray, and green accent colors, while data rows use white backgrounds to create clear visual hierarchy. With three columns for numerical input, this slide is ready to use for profit analysis, financial performance comparison, budget vs. actual reviews, and other financial presentations. The 2-slide set allows you to repeat the same layout or customize with different indicator combinations.
Usage Points
-
Main Usage
Present financial status, profit analysis, and financial performance in clear table format for easy comparison. The row-based layout allows stakeholders to quickly compare key metrics across different categories or time periods.
-
How to Use
Enter category names in the header row and numerical values in the data rows to display financial indicators. Use the blue, gray, and green header colors to distinguish indicator groups, and adjust column widths to accommodate various data combinations.
-
Recommended For
Ideal for finance teams, CFOs, and executives presenting financial reports, business plans, and investor pitch decks. Suitable for income statement visualization, financial planning presentations, budget analysis, quarterly performance reviews, and any business presentation requiring quantitative financial data display.
-
Slide Structure
3-row × 3-column table layout. The first row serves as a colored header (blue, gray, green) for category labels, while rows 2-3 feature white backgrounds with numerical input areas. Both slides maintain identical layouts for consistent presentation flow.
Related Products
-

Key Financial Indicators Table – Trust and Professionalism
#Financial Plans and Performance #Diagram #Income Statement
-

Premium Management Presentation Table – Efficient Financial Planning
#Financial Plans and Performance #Diagram #Income Statement
-

Leather Material Presentation Template Table Chart – Financial Performance Visualization
#Financial Plans and Performance #Diagram #Income Statement
-

Illustration Theme Income Statement Table – Visualization of Financial Performance
#Financial Plans and Performance #Diagram #Income Statement
