Shopping Mall Product Purchase Analysis – Insights Through Data Visualization
RJ0400046_34
- Last Update 05/29/2025
- File Size 0.9MB
- # of Slides 2
- File Format PPTX
- Slide Ratio 16:9
- Color
Keywords
- #Content-Based Slides
- #Design-Based Slides
- #Product/Service Introduction
- #Diagram
- #Program Introduction
- #Product and Service Overview
- #Cluster
- #Closed Cluster Diagram
- #16:9
- #shopping bag infographic PowerPoint
- #purchase analysis slide template
- #data visualization icons
- #sales chart PPT
- #3-color infographic template download
About the Product
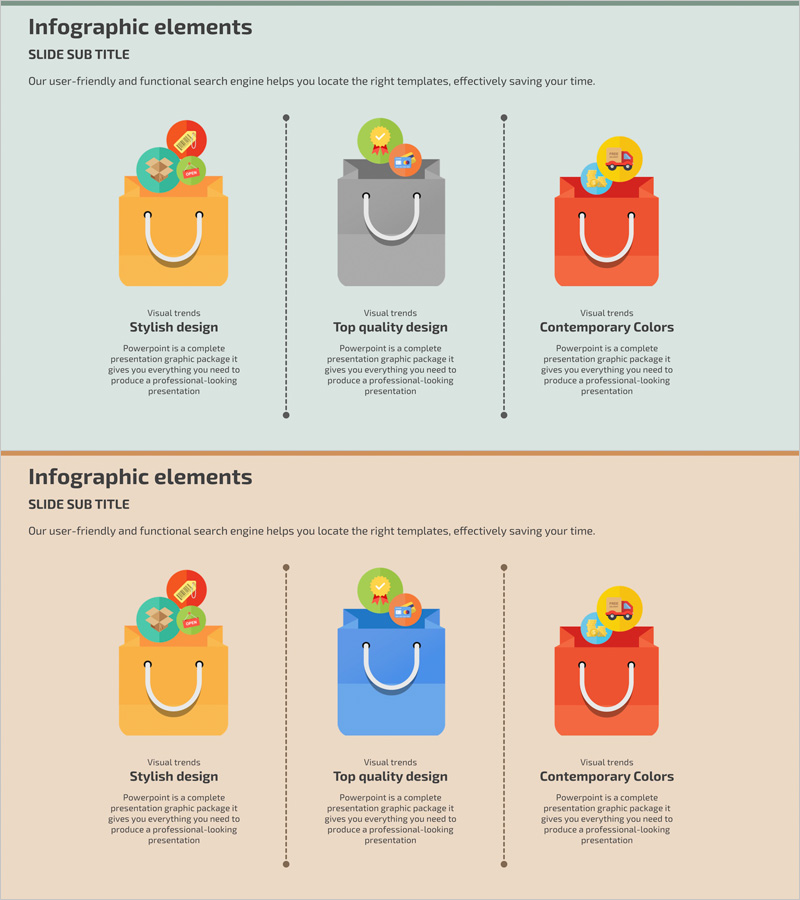
An infographic PowerPoint slide template for analyzing shopping mall product purchases and sales data. Features shopping bag icons in orange, teal, and gray with circular charts and badge elements positioned above to intuitively represent purchase patterns and sales metrics. The 2-slide set provides two color themes: light gray background and beige background. Each slide is divided into three independent data zones for parallel comparison of product-category purchase analysis results. Includes descriptive text areas with visual emphasis elements, ready for immediate use in marketing presentations, sales reports, and e-commerce strategy meetings.
Usage Points
-
Main Usage
An infographic slide designed to visually communicate purchase data analysis results for e-commerce and retail businesses. The combination of shopping bag icons, circular charts, and badge elements enables at-a-glance comparison of product-category sales volume and purchase ratios, serving as reporting material for marketing teams, sales departments, and executive presentations.
-
How to Use
Enter product names and category names in the three shopping bag areas on each slide, then replace the circular chart values and legends with actual sales data. Modify the badge icon text (Visual trends, Stylish design, Top quality design, Contemporary Colors) to reflect your analysis results or key insights. Select the background color theme that best matches your corporate brand and use accordingly.
-
Recommended For
Recommended for marketing teams, sales analysts, and executive presentation creators at e-commerce companies, online shopping malls, and retail distribution businesses. Ideal for quarterly or monthly sales performance presentations, product category purchase pattern analysis, and customer segment purchase behavior analysis presentations.
-
Slide Structure
2-slide composition. Each slide contains three independent data zones, with each zone featuring a shopping bag icon (orange, teal, or gray), circular chart (3–4 data series), and badge element (icon + text) arranged vertically. Slide 1 uses light gray background; Slide 2 uses beige background for color theme variation.
Related Products
-

Photo Concept Box for Product and Service Introduction – Creative Design
#Product/Service Introduction #Diagram #Text Box
-

List of Mobile App Projects – Innovation and Creativity
#Product/Service Introduction #Diagram #Program Introduction
-

Introducing Mobile Business Services – Innovation and Convenience
#Product/Service Introduction #Diagram #Program Introduction
-

Introduction to the Appendix Program – Engaging Program Structure
#Product/Service Introduction #Diagram #Program Introduction
