Data Analysis Program Overview – Visual Cluster
RJ0300077_14
- Last Update 05/10/2025
- File Size 1MB
- # of Slides 2
- File Format PPTX
- Slide Ratio 16:9
- Color
Keywords
- #Content-Based Slides
- #Design-Based Slides
- #Product/Service Introduction
- #Diagram
- #Program Introduction
- #Product and Service Overview
- #Cluster
- #Closed Cluster Diagram
- #16:9
- #cluster diagram PowerPoint
- #3-item comparison slide
- #data analysis presentation
- #central focus diagram
- #closed-form structure template
About the Product
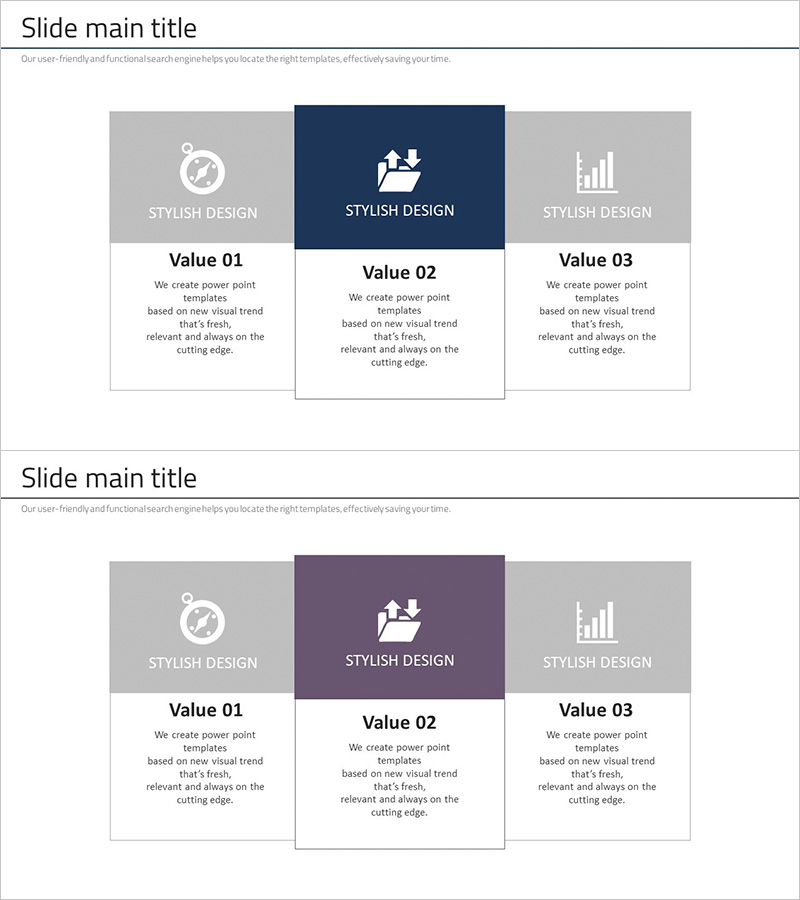
A PowerPoint slide that visualizes the core values of a data analysis program using a three-item closed-form cluster structure. The central emphasis area (dark navy) and left-right supporting areas (light gray) create a hierarchical information layout, with icons and text descriptions for each item clearly communicating program features. This 16:9 widescreen, 2-slide template is ready to use in presentations, proposals, and business overview slides.
Usage Points
-
Main Usage
Visualizes core functions or values of data analysis programs, software solutions, and business tools by dividing them into three distinct items. The central emphasis area highlights the most important message, while left-right supporting areas balance additional information.
-
How to Use
Use as a program overview slide at the beginning of presentations or place in proposal solution feature pages. Edit text and icons for each item to input the three core values of your actual program, and customize colors to match organizational branding.
-
Recommended For
Ideal for IT companies, software developers, and data analytics solution providers presenting product introductions. Also effective in executive reports, investment pitch decks, and technical seminar materials when summarizing key features.
-
Slide Structure
Two-slide set. Each slide features a title area at the top and a three-item cluster area at the bottom. The central item (dark navy background) is emphasized, while left-right items (light gray background) serve supporting roles. Each item includes icon, title, and description text input fields.
Related Products
-

Shopping Mall Product Purchase Analysis – Insights Through Data Visualization
#Product/Service Introduction #Diagram #Program Introduction
-

Aerospace Industry Introduction Diagram – Visualizing Cluster Information
#Product/Service Introduction #Diagram #Program Introduction
-

Photo Concept Box for Product and Service Introduction – Creative Design
#Product/Service Introduction #Diagram #Text Box
-

Introducing Mobile Business Services – Innovation and Convenience
#Product/Service Introduction #Diagram #Program Introduction
