Blue Yellow Line Graph – Market and Competitive Analysis
RJ0600026_12
- Last Update 06/27/2025
- File Size 0.3MB
- # of Slides 2
- File Format PPTX
- Slide Ratio 16:9
- Color
Keywords
- #Content-Based Slides
- #Design-Based Slides
- #Market and Competitor Analysis
- #Graph
- #Market Analysis
- #Industry Trends
- #Line
- #Line Chart
- #16:9
- #line chart PowerPoint
- #dual-series line graph template
- #market analysis slide
- #data trend visualization
- #competitive comparison presentation
- #line chart slide template
About the Product
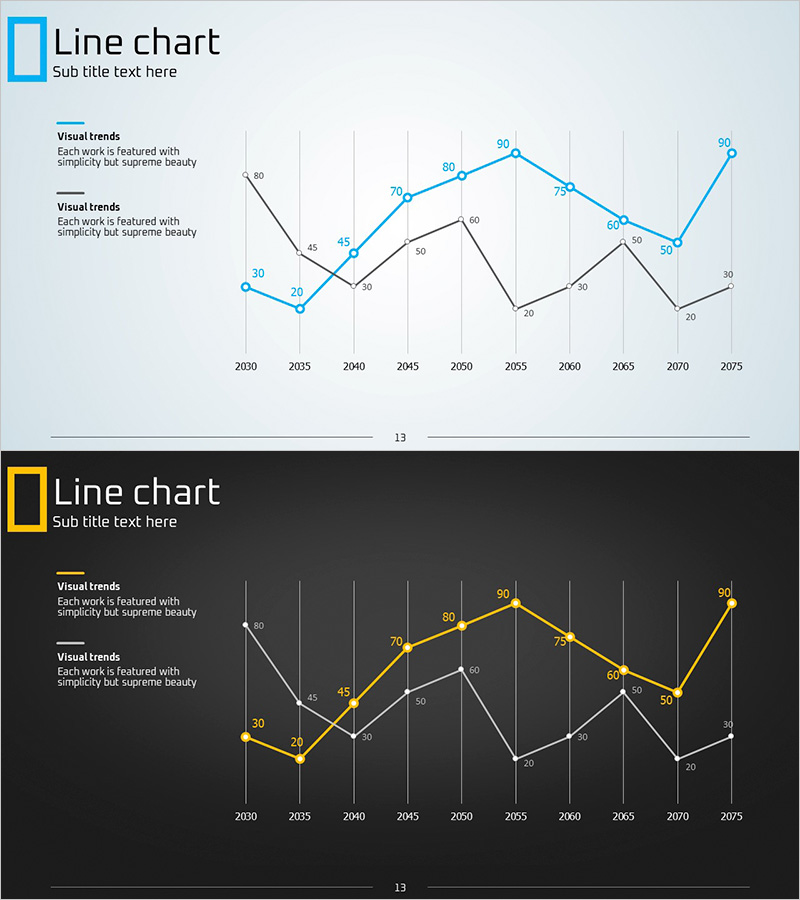
A dual-series line chart PowerPoint slide optimized for market analysis and competitive comparison. This presentation template visualizes long-term data trends from 2030 to 2075, with blue and black line series clearly distinguishing two separate trends. Each data point is labeled with numerical values for precise comparison, and a light gray grid background ensures easy value reading. The slide deck includes two design variations—light background and dark background versions—making it adaptable to different presentation environments. Ideal for business reports, market analysis presentations, and executive briefings.
Usage Points
-
Main Usage
Designed to compare long-term market trends and competitive performance simultaneously. The intersection points of the two line series highlight market turning points, while numerical labels support precise value comparison. Commonly used in business reports, market analysis presentations, and executive performance reviews.
-
How to Use
Ready to use with your own data input. Customize the blue and black line colors to match your company branding, and edit data points and numerical labels to reflect your analysis results. The light background version suits printed materials, while the dark background version is ideal for digital presentations.
-
Recommended For
Marketing professionals, business analysts, business development teams, and financial analysis departments presenting market trends and competitive benchmarking. Particularly effective for quarterly and annual performance comparisons, market share tracking, and competitive analysis documentation.
-
Slide Structure
Two-slide set featuring identical data on contrasting backgrounds—light gray background with blue and black lines on the first slide, dark background on the second. Each slide contains 10 data points spanning 2030–2075, with vertical gridlines and horizontal axis labels for precise value reading.
Related Products
-

Stock Market Trend Graph
#Market and Competitor Analysis #Graph #Market Analysis
-

Line Chart for Performance Variation Visualization – The Basics of Presentation
#Market and Competitor Analysis #Graph #Market Analysis
-

Mobile Market Analysis Bar & Line Charts – Trend Visualization
#Market and Competitor Analysis #Graph #Market Analysis
-

Graph of Industrial Change and Global Market Analysis – Understanding Market Trends
#Market and Competitor Analysis #Diagram #Graph
