Market Trends and Analysis – Harmony of Blue and Red
RJ0400020_6
- Last Update 05/23/2025
- File Size 0.2MB
- # of Slides 2
- File Format PPTX
- Slide Ratio 16:9
- Color
Keywords
- #Content-Based Slides
- #Design-Based Slides
- #Market and Competitor Analysis
- #Diagram
- #Graph
- #Market Analysis
- #Industry Trends
- #Table
- #Column
- #Vertical Table
- #Column Chart
- #16:9
- #vertical bar chart PowerPoint
- #bar graph slide template
- #data visualization PPT
- #market analysis chart
- #5-item comparison graph
About the Product
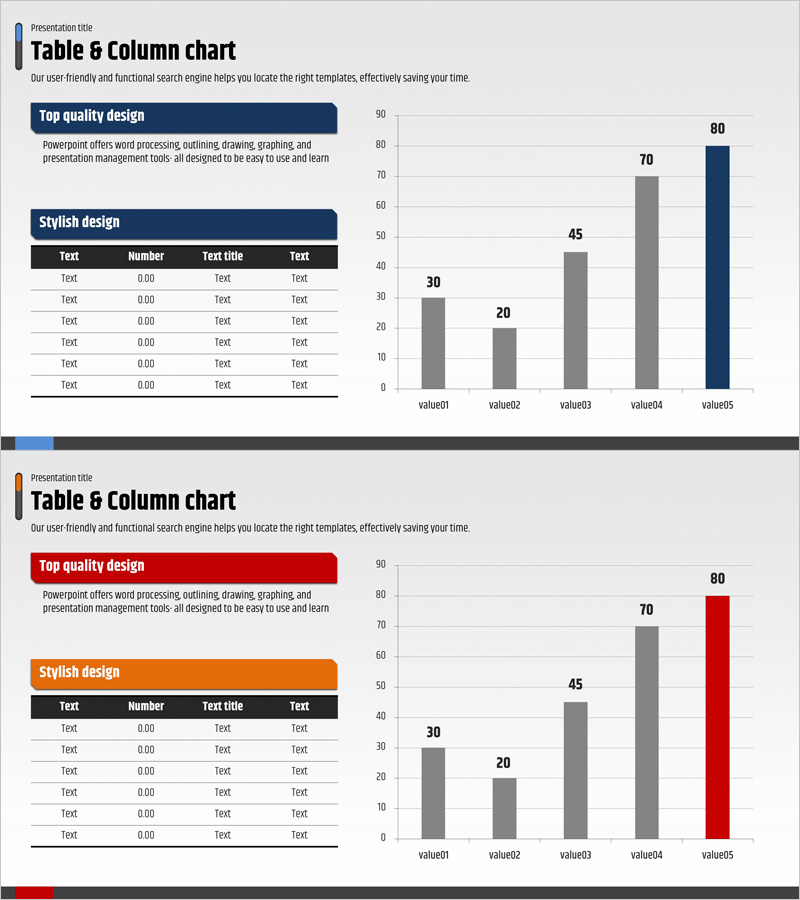
A vertical bar chart PowerPoint slide that intuitively expresses market trends and competitive analysis. This data visualization slide compares five data points with a harmonious blend of blue, gray, and red colors. The left side features 'Top Quality Design' and 'Stylish Design' sections with descriptive text, while the right side displays a five-step bar chart. By combining table and chart elements, this presentation template enhances information delivery and is ready to use for business reports, marketing analysis, and strategic planning presentations. The 16:9 widescreen format with 2-slide composition allows easy customization.
Usage Points
-
Main Usage
This data visualization slide clearly compares five data points such as market trends, competitive analysis, and sales performance. The color contrast of blue, gray, and red emphasizes differences between items, while the two-column layout with text on the left and chart on the right maximizes information delivery.
-
How to Use
Apply this slide to the market analysis section of business reports, competitor comparison pages in marketing plans, and quarterly or annual performance presentations. Enter analysis content in the left text boxes and edit the graph values and labels to match your data.
-
Recommended For
Recommended for executives, marketing managers, sales directors, consultants, and analysts who require data-driven decision-making. Ideal for quarterly performance reports, market research presentations, competitive analysis meetings, and investor briefings where quantitative comparison is essential.
-
Slide Structure
Two-slide composition with each slide divided into left information area (two text boxes) and right data area (five-item vertical bar chart). The first slide features a dark blue header, and the second has a red header for visual variety. The 16:9 widescreen format is optimized for modern projectors and monitors.
Related Products
-

Market Overview PowerPoint Slide – Two Panel Market Analysis
#Market and Competitor Analysis #Graph #Market Status
-

Bar Graph for Market Trend Analysis – Effective Market Insights
#Market and Competitor Analysis #Graph #Market Analysis
-

Mobile Market Analysis Bar & Line Charts – Trend Visualization
#Market and Competitor Analysis #Graph #Market Analysis
-

Market Trend Analysis Bar Graph & Table
#Market and Competitor Analysis #Diagram #Graph
