City Background Broken Line Graph – Market Trend Analysis
RJ0300059_12
- Last Update 05/04/2025
- File Size 1.4MB
- # of Slides 2
- File Format PPTX
- Slide Ratio 16:9
- Color
Keywords
About the Product
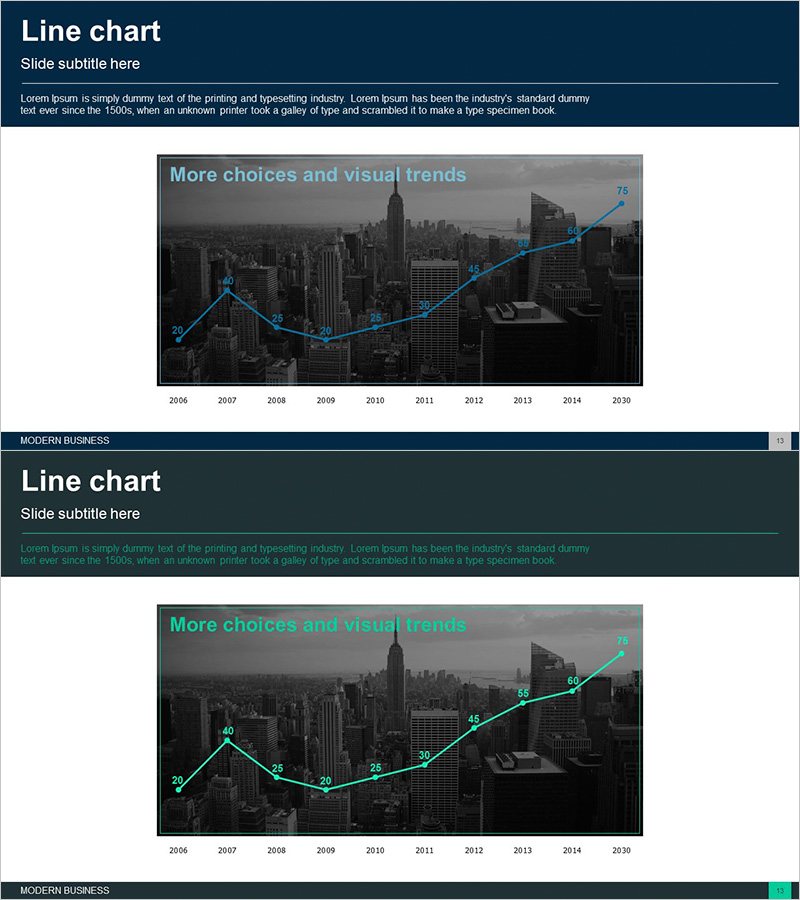
A 2-slide PowerPoint set featuring a blue line chart overlaid on an urban skyline background. Visualizes market trends from 2006 to 2030 with data point labels for precise value communication. The first slide uses a dark navy background with bright blue line, while the second applies a green-toned line to the same data structure. Each data point is labeled with numerical values, and the combination of cityscape imagery with the chart reinforces business credibility. Delivered in 16:9 widescreen PPTX format, fully editable and ready for immediate use in professional presentations.
Usage Points
-
Main Usage
Ideal for visualizing time-series data such as market trends, sales performance, growth rates, and revenue changes. The urban background enhances credibility for global business and economic analysis, while two color variations accommodate diverse presentation contexts.
-
How to Use
Insert into market analysis sections of business reports, performance metrics presentations at investor meetings, or trend analysis pages in marketing plans. Simply replace existing data, adjust line colors, data points, and labels for immediate deployment.
-
Recommended For
Finance executives, marketing managers, consultants, and business analysts presenting data-driven insights. Suitable for quarterly earnings presentations, market research findings, and strategic growth planning meetings.
-
Slide Structure
2-slide composition with identical line chart structure (10 data points spanning 2006–2030, single series). First slide features dark navy background with bright blue line; second slide uses dark gray background with green-toned line. Both maintain consistent data visualization layout.
Related Products
-

Graph of Industrial Change and Global Market Analysis – Understanding Market Trends
#Market and Competitor Analysis #Diagram #Graph
-

Market Analysis Template with Line Graphs and Horizontal Bar Charts
#Market and Competitor Analysis #Graph #Market Analysis
-

Stock Market Trend Graph
#Market and Competitor Analysis #Graph #Market Analysis
-

Market Trend Analysis of Traditional Tea – Market Share Changes
#Market and Competitor Analysis #Graph #Market Analysis
