Mobile Market Analysis Bar & Line Charts – Trend Visualization
RM0700001_14
- Last Update 02/25/2025
- File Size 2.1MB
- # of Slides 2
- File Format PPTX
- Slide Ratio 16:9
- Color
Keywords
- #Content-Based Slides
- #Design-Based Slides
- #Market and Competitor Analysis
- #Graph
- #Market Analysis
- #Industry Trends
- #Column
- #Line
- #Column Chart
- #Line Chart
- #16:9
- #line chart PowerPoint slide
- #market analysis presentation template
- #trend visualization
- #dual-series line graph
- #how to create line chart in PowerPoint
About the Product
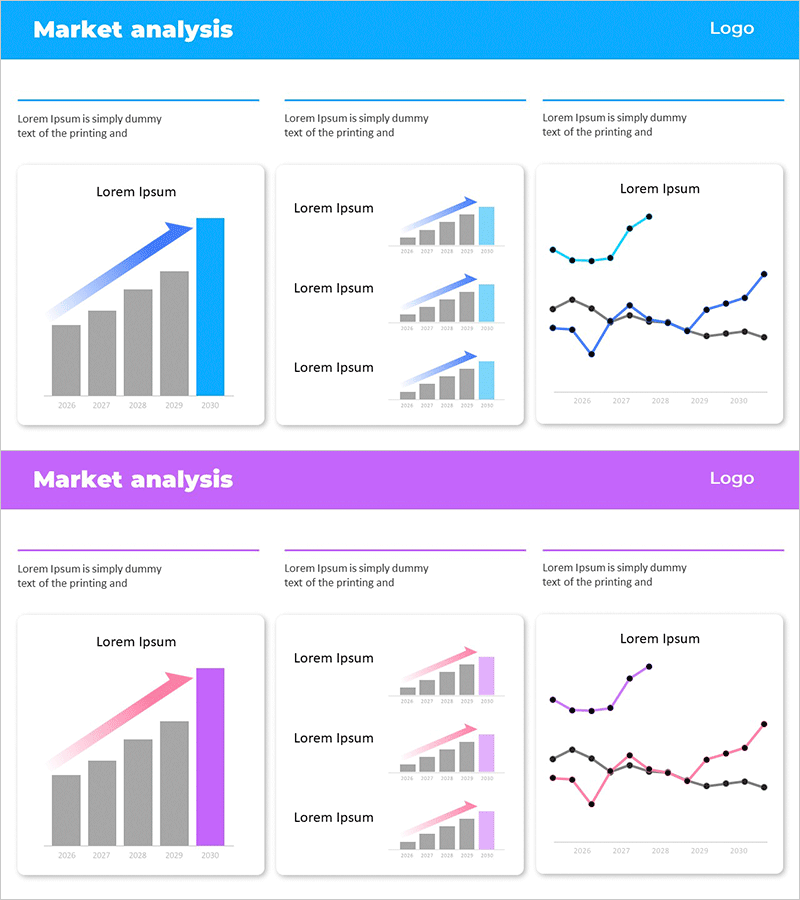
A dual-series line chart PowerPoint slide set optimized for market analysis presentations. Two trend lines in blue and black clearly display time-based changes, complemented by vertical bar graphs in the background for multi-layered data comparison. This 2-slide PPTX template is fully editable and ready for immediate use in mobile, IT, and financial market presentations. The 16:9 widescreen format ensures compatibility with modern display standards.
Usage Points
-
Main Usage
Visualizes time-based trends across two or more data series, such as market growth, competitive benchmarking, and revenue progression. The ascending, descending, and fluctuating line patterns effectively communicate market potential, risk factors, and emerging opportunities to stakeholders.
-
How to Use
Insert monthly, quarterly, or annual data in the market analysis or competitive analysis sections. Use the blue series for primary metrics and the black series for comparative benchmarks to guide audience focus. The accompanying vertical bar graphs reinforce quantitative credibility and provide context for trend interpretation.
-
Recommended For
Ideal for market research reports, business plans, investor pitch decks, quarterly earnings presentations, and executive briefings. Recommended for marketing, strategy, and finance professionals in mobile, IT, financial services, and retail sectors where market volatility and trend analysis are critical.
-
Slide Structure
Slide 1: Dual-series line chart with blue primary trend and black comparative trend across 5 data points (2025–2030). Slide 2: Three-section vertical bar graph layout with trend line overlay. All elements are fully editable with customizable colors, data values, and axis labels in 16:9 format.
Related Products
-

Stock Market Trend Graph
#Market and Competitor Analysis #Graph #Market Analysis
-

City Background Broken Line Graph – Market Trend Analysis
#Market and Competitor Analysis #Graph #Market Analysis
-

Modern Theme Bar Graph – Optimized Design for Market Analysis
#Market and Competitor Analysis #Graph #Market Analysis
-

Line Chart for Performance Variation Visualization – The Basics of Presentation
#Market and Competitor Analysis #Graph #Market Analysis
