Business Analysis Chart – Visualizing Competitive Advantage
RJ0300097_28
- Last Update 05/16/2025
- File Size 0.3MB
- # of Slides 2
- File Format PPTX
- Slide Ratio 16:9
- Color
Keywords
- #Content-Based Slides
- #Design-Based Slides
- #Market and Competitor Analysis
- #Graph
- #Other
- #Competitor Analysis
- #Competitive Advantage
- #Column
- #Grouped Column
- #Mockup
- #16:9
- #clustered column chart PowerPoint
- #dual-series bar chart slide
- #business analysis chart template
- #competitive analysis PowerPoint
- #data comparison slide download
About the Product
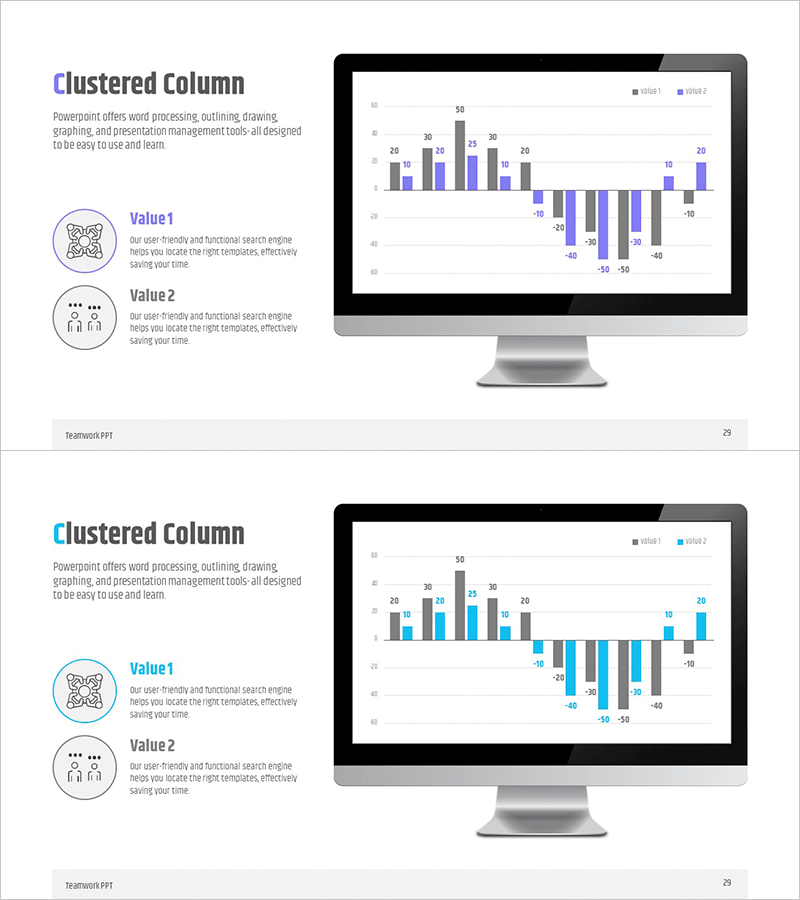
A professional clustered column chart PowerPoint slide designed for business analysis and competitive advantage visualization. This 2-slide template features both horizontal and vertical bar chart layouts to compare two data series side by side. The purple and blue color scheme clearly distinguishes between data series, while numeric labels ensure precise value communication. Ideal for competitive analysis, performance benchmarking, market share assessment, and strategic presentations that require quantitative data visualization.
Usage Points
-
Main Usage
This slide template enables clear comparison of two data series through clustered bar charts in both horizontal and vertical orientations. The purple and blue color differentiation highlights series distinctions, making quantitative data analysis accessible to audiences. Perfect for competitive benchmarking, performance evaluation, and market analysis presentations requiring visual data representation.
-
How to Use
Simply replace the sample data and labels with your own figures to customize the charts instantly. The horizontal layout suits item-by-item comparisons, while the vertical layout effectively displays trend analysis. Colors and numeric labels are fully editable to match your corporate branding, and the template is optimized for 16:9 widescreen displays.
-
Recommended For
Ideal for executives, business analysts, marketing professionals, and consultants presenting in board meetings, quarterly reviews, investment pitches, consulting proposals, and strategic planning sessions. Particularly effective for competitive analysis and performance evaluation sections where quantitative comparison is essential.
-
Slide Structure
Two-slide template featuring clustered column charts in both orientations. Slide 1: horizontal clustered bars (approximately 10 categories, 2 series). Slide 2: vertical clustered columns (approximately 10 categories, 2 series). Each slide includes legend labels (Value1, Value2), numeric data labels, and descriptive text areas.
Related Products
-

Visualizing Market Trends with Musician Comparison Graphs
#Market and Competitor Analysis #Diagram #Graph
-

Market Competition: Deep Dive into Top 3 Firms
#Market and Competitor Analysis #Graph #Competitor Analysis
-

Past Present Comparative Analysis Bar Graph – Emphasizing Market Competitive Advantage
#Market and Competitor Analysis #Graph #Competitor Analysis
-

Business Bundle Bar Graph – Market Analysis and Competitive Edge
#Market and Competitor Analysis #Graph #Competitor Analysis
