Vertical Bar Chart Slide for Business Competitive Advantage Analysis
RJ0300048_15
- Last Update 05/01/2025
- File Size 6.2MB
- # of Slides 2
- File Format PPTX
- Slide Ratio 16:9
- Color
Keywords
- #Content-Based Slides
- #Design-Based Slides
- #Market and Competitor Analysis
- #Graph
- #Other
- #Competitor Analysis
- #Competitive Advantage
- #Column
- #Column Chart
- #Silhouette
- #16:9
- #vertical bar chart PowerPoint
- #competitive advantage analysis presentation
- #business comparison slide
- #bar graph template
- #competitive analysis deck
About the Product
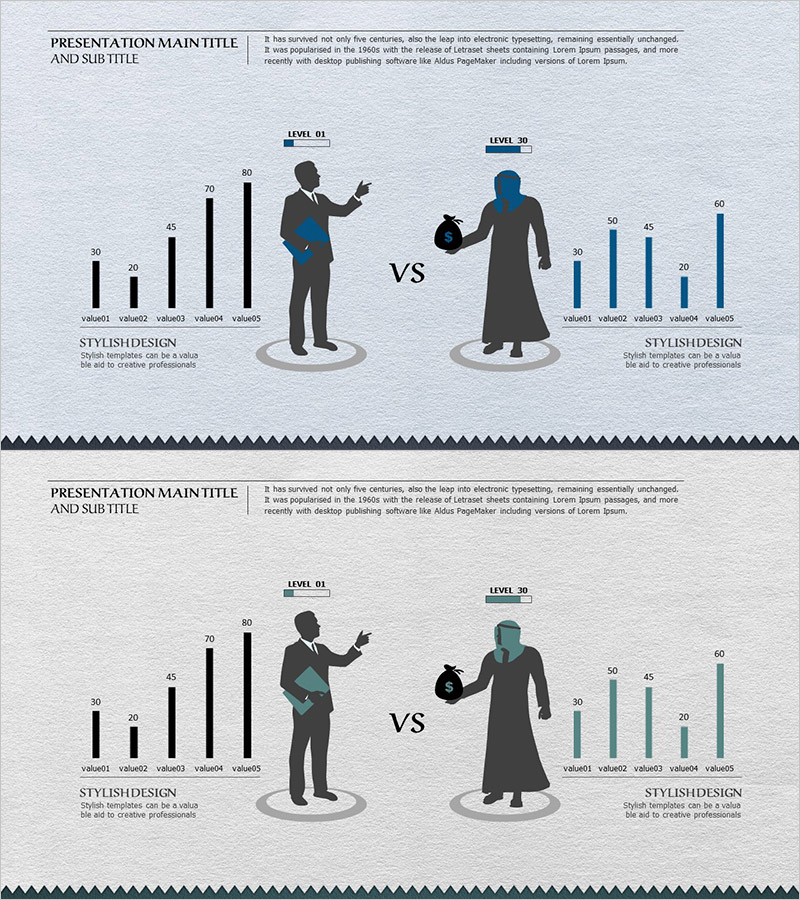
A vertical bar chart PowerPoint slide designed for analyzing business competitive advantage through visual comparison. This 2-slide presentation features two comparison scenarios: Level 01 and Level 30, each displaying five data items (value01 through value05) represented by bar heights. Dark-toned background with black silhouette figures and blue bar graphs emphasizes competitive analysis clarity. Optimized for modern 16:9 widescreen presentations and provided in fully editable PPTX format for immediate customization.
Usage Points
-
Main Usage
Visualizes competitive positioning by comparing five key metrics between your company and competitors using numerical data. Ideal for marketing strategy presentations, market research reports, investor pitch decks, and competitive analysis sections. Bar height differences provide intuitive numerical comparison and ranking visualization.
-
How to Use
Enter actual numerical values into value01 through value05 fields and bar heights automatically adjust proportionally. Utilize both Level 01 and Level 30 versions to present multiple competitive scenarios. Colors and background styling are fully customizable to match corporate branding guidelines.
-
Recommended For
Marketing managers, strategic planning teams, and sales executives presenting competitive analysis findings. Recommended for business plans, proposal documents, quarterly performance reports, and investor relations materials requiring competitive positioning sections.
-
Slide Structure
Two-slide layout with left-aligned black silhouette figures (level indicators), centered 'VS' text, and right-aligned blue vertical bar graphs. Each graph displays five data items as proportional bar heights with level labels at top and 'STYLISH DESIGN' text at bottom.
Related Products
-

Comparative Analysis Graph – Market and Competitor Analysis
#Market and Competitor Analysis #Graph #Competitor Analysis
-

3 Competitive Advantage Graphs – Market and Competitor Analysis
#Market and Competitor Analysis #Graph #Competitor Analysis
-

Competitor Comparison Analysis Bar Graph
#Market and Competitor Analysis #Graph #Competitor Analysis
-

Gradient Vertical Bar Chart – Suitable for Market and Competitive Analysis
#Market and Competitor Analysis #Graph #Competitor Analysis
