Sales and Profit Calculation Table – Key to Profit Management
RJ0300011_14
- Last Update 04/21/2025
- File Size 0.1MB
- # of Slides 2
- File Format PPTX
- Slide Ratio 16:9
- Color
Keywords
- #Content-Based Slides
- #Design-Based Slides
- #Financial Plans and Performance
- #Diagram
- #Income Statement
- #Sales and Revenue
- #Table
- #Standard Table
- #16:9
- #sales profit calculation table PowerPoint
- #financial data table slide template
- #how to create financial table in PowerPoint
- #profit management presentation slide
- #financial report PowerPoint template
About the Product
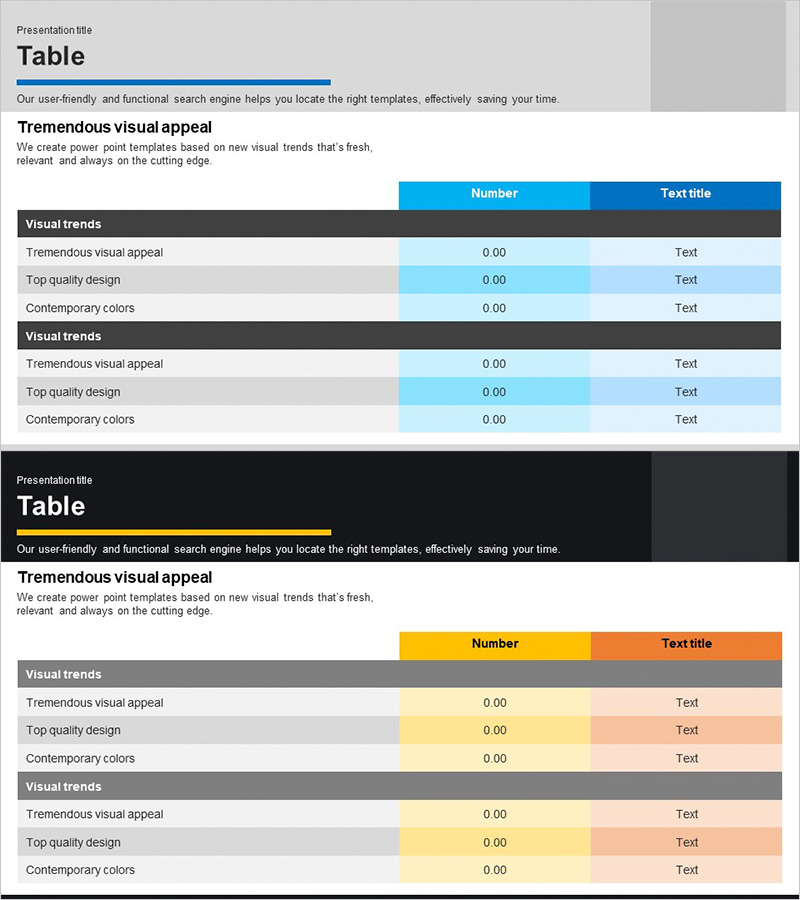
A 2-slide financial data table PowerPoint presentation designed to organize and present sales, profit, and loss information clearly. Available in two color schemes—blue and orange—each slide features a 3-column structure with row headers (Visual trends) and column headers (Number, Text title). The layout provides distinct input areas for financial metrics, making it ideal for financial reports, business plans, quarterly performance reviews, and investor presentations. The table format enables direct comparison of revenue figures and profit margins, supporting data-driven decision-making discussions in executive meetings.
Usage Points
-
Main Usage
To systematically organize and visualize financial data including sales, profit, and loss information. The table structure separates line items by row and displays numerical values and descriptions by column, enabling stakeholders to quickly assess financial performance. Designed for regular financial reporting, executive briefings, and performance analysis where key financial metrics need clear presentation.
-
How to Use
Enter line item names (sales, profit, loss, etc.) in the first column, input numerical data in the Number column, and add explanatory text or analysis notes in the Text title column. Use the blue color scheme for corporate reports emphasizing stability and trust, or the orange scheme for presentations highlighting positive results and growth. Arrange both slides sequentially to show period-over-period comparisons or scenario analysis.
-
Recommended For
CFOs, finance managers, executives, and business development teams presenting quarterly or annual financial results. Suitable for investor presentations, board meetings, internal management briefings, business plan documentation, and financial training sessions. Also effective for explaining profit-and-loss concepts in employee onboarding or finance fundamentals seminars.
-
Slide Structure
Each slide contains a 3-column by 6-row table (1 header row + 5 data rows). Column headers are Number and Text title, with row headers labeled Visual trends. The first slide features a blue header with light blue data cells; the second slide uses an orange header with light orange data cells. All cells are formatted as editable text fields for easy data input and customization.
Related Products
-

Sales and Profit Analysis Chart – An Effective Tool for Financial Performance
#Financial Plans and Performance #Diagram #Income Statement
-

Profit Analysis Graph – Visualizing Financial Performance
#Financial Plans and Performance #Diagram #Income Statement
-

Global Revenue Analysis Table – Table for Financial Performance Enhancement
#Financial Plans and Performance #Diagram #Other
-

Income Statement Results Table - Visualizing Financial Performance
#Financial Plans and Performance #Diagram #Income Statement
