Sales and Profit Calculation Table – Efficient Profit Management
RJ0300063_28
- Last Update 05/05/2025
- File Size 4.3MB
- # of Slides 2
- File Format PPTX
- Slide Ratio 16:9
- Color
Keywords
About the Product
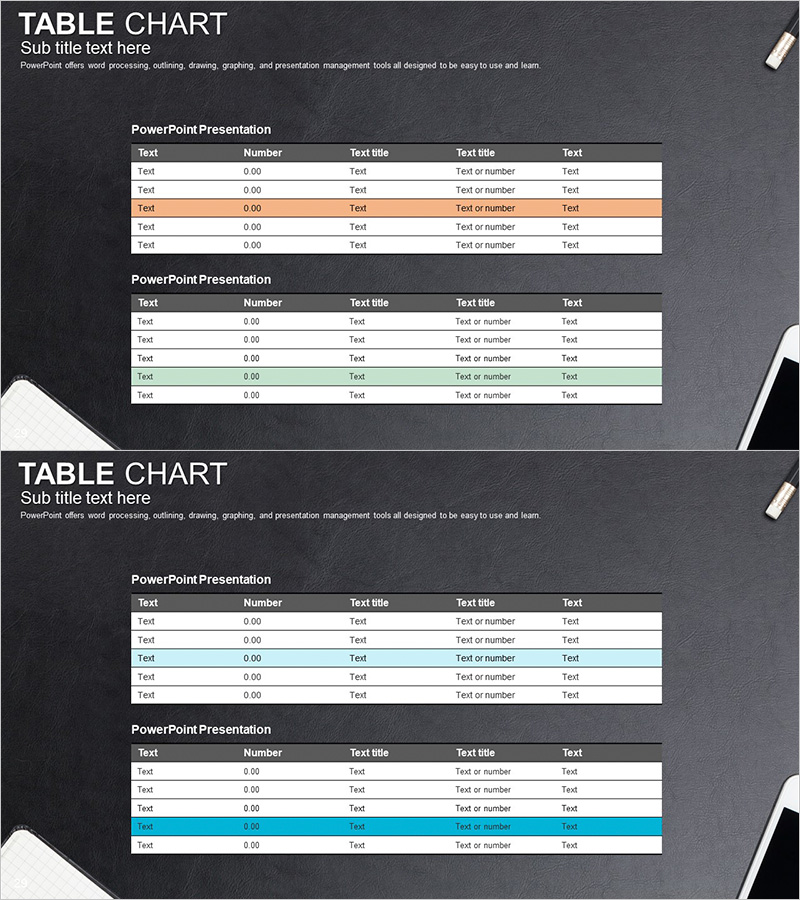
A professional calculation table PowerPoint slide designed for efficient sales and profit management. This 2-slide deck features a dark gray background with white text and orange and green highlight rows, providing clear visualization of financial data. With 5 columns (text, number, title, title, text), you can organize sales figures, profit margins, cost analysis, and other financial metrics effectively. Optimized for 16:9 widescreen format in PPTX, fully editable and ready to integrate into financial presentations, business reports, and investment pitch decks.
Usage Points
-
Main Usage
Organize and compare financial data systematically using this calculation table slide. Display key metrics including sales, profit, costs, and profit margins across 5 distinct columns. Orange and green highlight rows visually emphasize important figures, while the dark background ensures high contrast for projector presentations and maintains data readability in any environment.
-
How to Use
Insert into business plans, financial reports, quarterly earnings presentations, and investor pitch decks. Simply input your actual sales, profit, and cost data into the text, number, and title fields. Customize highlight row colors (orange or green) to emphasize different metrics, and duplicate rows to expand the table as needed for additional data points.
-
Recommended For
Ideal for CFOs, finance managers, and executives presenting financial performance. Perfect for startup investment pitches, SME business plans, corporate quarterly earnings reports, and consulting proposals requiring financial analysis sections. Also suitable for educational institutions presenting budget overviews and nonprofit organizations reporting fund utilization.
-
Slide Structure
2-slide layout with each slide containing 5 columns (text, number, title, title, text) and 5 data entry rows. First slide features one orange highlight row; second slide features one green highlight row, allowing separate data set representation. Header row uses dark gray background for consistency, while data rows use white background for clear visual separation and improved readability.
Related Products
-

Bank Income Statement – Visualizing Financial Performance
#Financial Plans and Performance #Diagram #Income Statement
-

Business Income Statement – Visualizing Financial Performance
#Financial Plans and Performance #Diagram #Income Statement
-

Profit Analysis Graph – Visualizing Financial Performance
#Financial Plans and Performance #Diagram #Income Statement
-

Orange Green Profit and Loss Chart – Visualizing Revenue and Profit
#Financial Plans and Performance #Diagram #Graph
