Business Sales and Profit Calculation Table – Essential Slide for Financial Planning
RJ0300055_11
- Last Update 05/02/2025
- File Size 0.6MB
- # of Slides 2
- File Format PPTX
- Slide Ratio 16:9
- Color
Keywords
- #Content-Based Slides
- #Design-Based Slides
- #Financial Plans and Performance
- #Diagram
- #Income Statement
- #Sales and Revenue
- #Table
- #Standard Table
- #16:9
- #financial data table PowerPoint
- #sales profit calculation slide
- #business table template
- #financial planning slide
- #how to create financial table in PowerPoint
About the Product
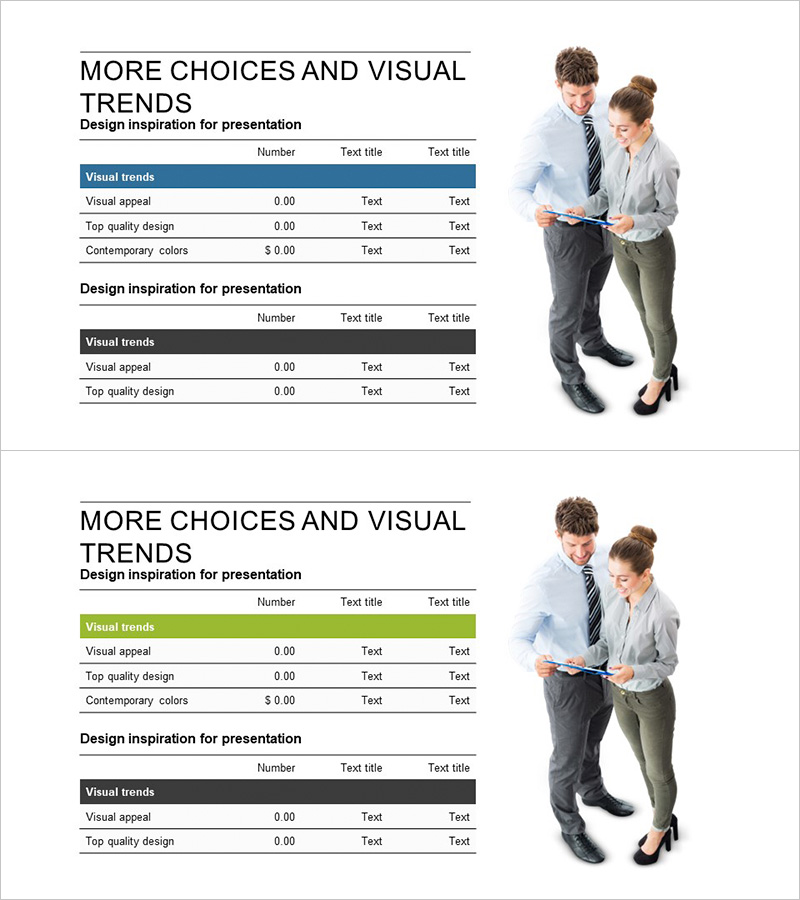
An essential financial data table PowerPoint slide for business planning and reporting, featuring sales and profit calculation templates. The 2-slide set includes a structured table layout with visual trend information and a corresponding editable data entry slide. Dark blue header rows with white text ensure professional presentation of financial metrics, while maintaining full editability for numbers and text fields. Ideal for business reports, investment pitches, quarterly financial reviews, and executive presentations requiring clear data visualization.
Usage Points
-
Main Usage
Present key financial metrics such as sales, revenue, costs, and profit in a clear, organized table format for business reports and financial planning presentations. The structured layout enables quick comparison of financial data and enhances audience comprehension of complex financial information.
-
How to Use
Enter actual sales and profit figures into the first slide's table, and add or modify rows and columns as needed to include additional metrics like cost of goods sold or profit margins. Use the second slide for alternative scenarios or projected financial data. Customize header colors and fonts to match your corporate branding.
-
Recommended For
CFOs, financial analysts, business planners, and investment managers presenting quarterly financial reports, investor pitches, business performance reviews, and executive briefings. Suitable for startup pitch decks, corporate earnings presentations, and management consulting reports.
-
Slide Structure
2-slide layout with consistent design. Each slide features a title area at the top, visual trend information box on the left, and a horizontal data table on the right. The table contains 3–4 rows (sales, revenue, costs, profit) and 3–4 columns (item, amount, percentage, notes) with dark blue header and white text formatting.
Related Products
-

Business Income Statement Slide - Highlighting Financial Performance
#Financial Plans and Performance #Diagram #Income Statement
-

Orange Green Profit and Loss Chart – Visualizing Revenue and Profit
#Financial Plans and Performance #Diagram #Graph
-

Sales and Profit Table – Clear Visualization of Financial Planning
#Financial Plans and Performance #Diagram #Other
-

Profit Analysis Graph – Visualizing Financial Performance
#Financial Plans and Performance #Diagram #Income Statement
