High Quality Gradient Bar Graph – Market and Competitor Analysis
RJ0600092_14
- Last Update 08/28/2025
- File Size 0.1MB
- # of Slides 2
- File Format PPTX
- Slide Ratio 16:9
- Color
Keywords
- #Content-Based Slides
- #Design-Based Slides
- #Market and Competitor Analysis
- #Graph
- #Market Analysis
- #Competitive Advantage
- #Column
- #Grouped Column
- #16:9
- #grouped bar chart PowerPoint
- #gradient bar graph template
- #market analysis slide
- #competitor comparison chart
- #4-item data visualization
- #how to create grouped bar chart in PowerPoint
About the Product
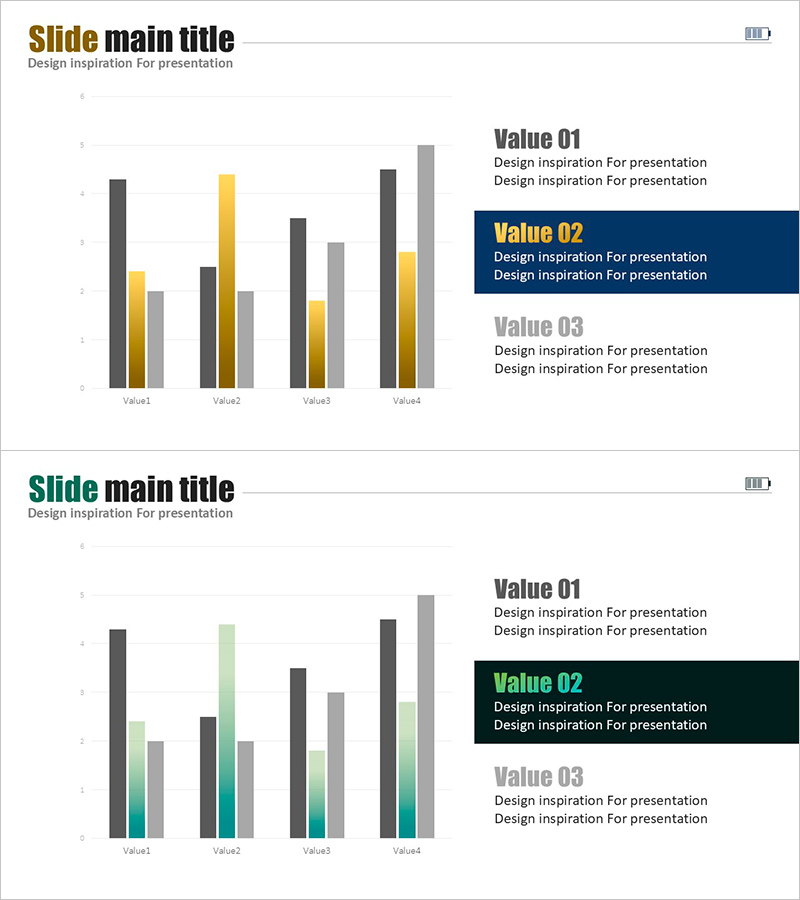
A grouped bar chart PowerPoint slide optimized for market analysis and competitor comparison presentations. Features gradient color schemes in gold, gray, and teal tones that enable clear visual comparison of four data items across multiple categories. The dual-axis structure supports both horizontal and vertical data layouts, making it adaptable to various business scenarios. Two-slide design provides color variation options that can be customized to match corporate branding guidelines. Ideal for executive reports, investor pitches, and strategic planning presentations.
Usage Points
-
Main Usage
Compares four data items simultaneously across multiple categories such as market size, competitor performance, or departmental results. Gradient coloring creates visual hierarchy that emphasizes key metrics. Suitable for investor presentations, executive briefings, and marketing strategy discussions.
-
How to Use
Input numerical values for each item and the bar heights adjust automatically. Two color palette options (gold-gray and teal-gray) are provided for selection based on presentation theme. Modify legend labels and axis titles to clarify data context and narrative.
-
Recommended For
Finance, marketing, and strategy professionals presenting quantitative comparative analysis. Recommended for quarterly performance reviews, market share analysis, competitive positioning reports, and investor communications. Frequently used in executive summaries, pitch decks, and consulting proposals.
-
Slide Structure
Slide 1: Four grouped bars in gold-gray tones with three Value text boxes / Slide 2: Identical structure in teal-gray tones. Each slide displays 4 items × 3 series (dark gray, gold, light tone) totaling 12 data points for comprehensive multi-dimensional comparison.
Related Products
-

Circular Gradient Wide Template Bundled Charts
#Market and Competitor Analysis #Graph #Market Analysis
-

Mobile Service Analysis Graph – Visualizing Market Competitiveness
#Market and Competitor Analysis #Diagram #Graph
-

Graph Analysis of Growth – Data Visualization for Competitive Advantage
#Market and Competitor Analysis #Diagram #Graph
-

Modern Business Plan Template – Clustered Column Graph
#Market and Competitor Analysis #Graph #Market Analysis
