Introduction to the History of the Architectural Company – A Visual Timeline
RJ0300034_5
- Last Update 04/27/2025
- File Size 6.1MB
- # of Slides 2
- File Format PPTX
- Slide Ratio 16:9
- Color
Keywords
- #Content-Based Slides
- #Design-Based Slides
- #Company Introduction
- #Diagram
- #Company Overview
- #History
- #Cluster
- #Closed Cluster Diagram
- #Chain Diagram
- #16:9
- #timeline diagram PowerPoint
- #company history presentation slide
- #vertical flow diagram
- #architectural company timeline
- #connection diagram template
About the Product
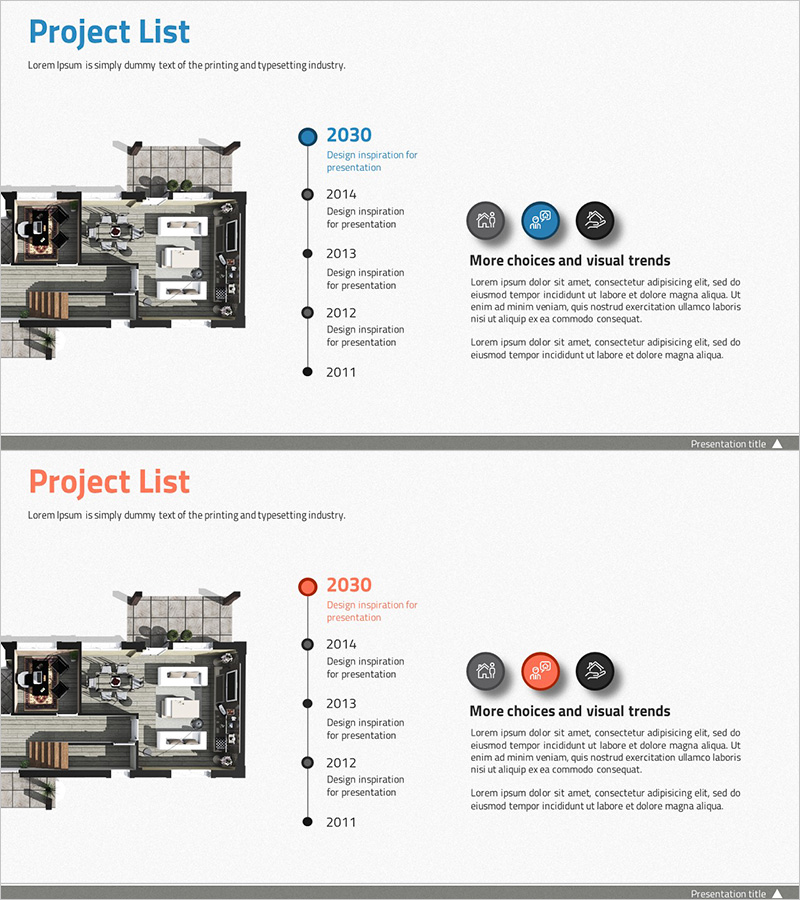
A vertical timeline diagram PowerPoint slide designed to visually present the history and milestones of an architectural company. Five nodes are arranged alternately on the left and right sides of a central axis, clearly conveying key events in chronological order. The design features a dark background with blue and black circular nodes connected by lines, creating a professional representation of company growth. Each stage includes ample text input areas for project milestones, technology adoption, business expansion, and other historical information. This 16:9 widescreen 2-slide presentation is ready for immediate use in corporate presentations.
Usage Points
-
Main Usage
Effectively communicate organizational growth and development history by arranging major milestones from company founding to present in chronological order. Optimized for corporate introductions and credibility building in architecture, real estate, and engineering industries.
-
How to Use
Enter years and key events (establishment, branch opening, project completion, technology adoption) in each node's text box. Modify colors to distinguish event importance or add icons for category differentiation. Use in company profile presentations, annual reports, and investor briefing slides.
-
Recommended For
Ideal for executives, sales teams, and investors in architecture, construction, real estate, and engineering companies. Suitable for new employee orientation, recruitment presentations, and corporate promotional materials. Recommended for all business presentations emphasizing organizational history and credibility.
-
Slide Structure
Five nodes arranged alternately around a central vertical axis (3 on left, 2 on right). Each node is represented as a circular shape (approximately 40px diameter) connected to the central axis by lines emphasizing temporal flow. Text input areas (year, event name, description) are positioned to the right of each node, creating clear information hierarchy.
Related Products
-

Isometric Eco-Friendly History – A Journey Towards Sustainability
#Company Introduction #Diagram #History
-

Visualizing Trends in Aerobic Training – Timeline Diagram
#Company Introduction #Diagram #History
-

Scientific Closed Diagram – Cluster Type Connection Structure
#Company Introduction #Diagram #Company Overview
-

Research and Development Overview Diagram – Innovation and Progress
#Company Introduction #Product/Service Introduction #Diagram
