Fountain Pen History Diagram – Emphasizing Corporate Identity
RJ0300047_5
- Last Update 05/01/2025
- File Size 3.5MB
- # of Slides 2
- File Format PPTX
- Slide Ratio 16:9
- Color
Keywords
- #Content-Based Slides
- #Design-Based Slides
- #Company Introduction
- #Product/Service Introduction
- #Diagram
- #History
- #Composition
- #Cluster
- #Chain Diagram
- #16:9
- #timeline diagram PowerPoint
- #company history slide template
- #milestone timeline PPT
- #product evolution diagram
- #corporate timeline presentation slide
About the Product
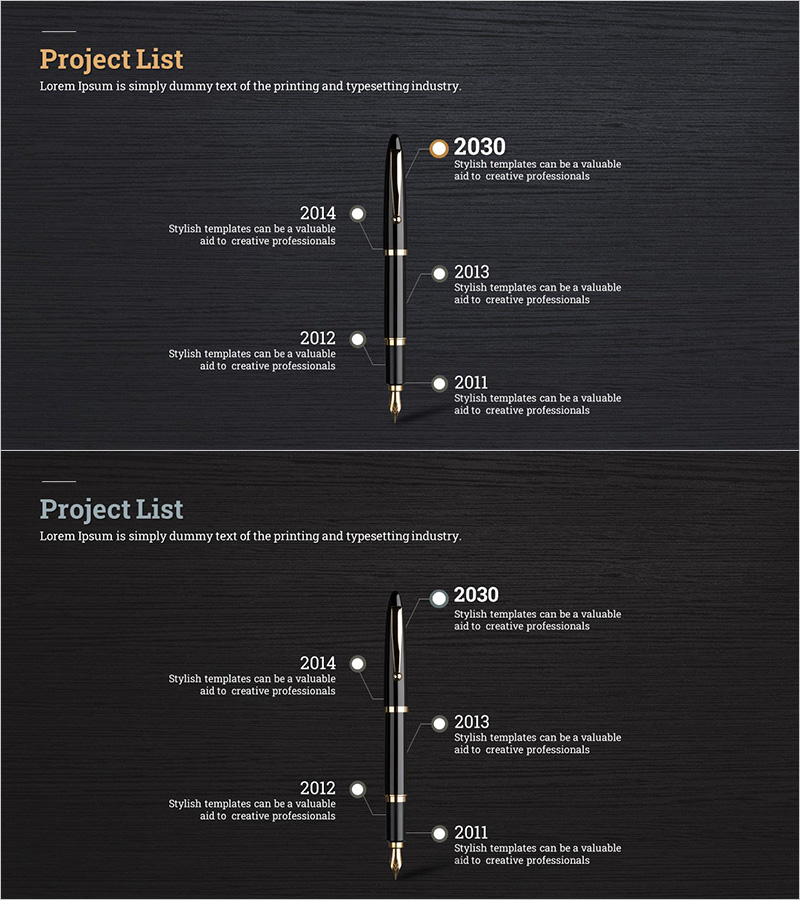
A timeline connection diagram PowerPoint slide featuring five milestone points linked to a central vertical axis, ideal for presenting company history and product evolution. The design combines a dark background with gold accent markers and white typography to emphasize corporate identity and professional branding. Each year is represented as a node connected to the central timeline, effectively visualizing product development stages, company milestones, and corporate growth trajectory. The 2-slide template is fully editable and ready for use in company presentations, investor pitches, and product launch decks.
Usage Points
-
Main Usage
Visualize company history, product development milestones, and corporate growth timeline in chronological order. The central-axis node structure clearly highlights key events and demonstrates sustained business expansion to your audience.
-
How to Use
Use in company overview presentations, product evolution sections, corporate annual reports, investor relations decks, and brand history narratives. Easily customize the year labels and text descriptions to match your company or product timeline data.
-
Recommended For
Ideal for executives, marketing professionals, product managers, and investor relations teams. Particularly effective when presenting long-term company growth stories, product line expansion, brand heritage narratives, and corporate value propositions.
-
Slide Structure
Symmetrical layout with a central vertical axis and five nodes (2011, 2012, 2013, 2014, 2030) positioned left and right. Each node features a gold circular marker with white text labels, connected to the central axis by lines representing temporal flow. Dark gray background with gold accents reinforces premium corporate branding.
Related Products
-

Cluster Diagram Slide for Event Planning – Strategic Roadmap
#Company Introduction #Business Strategy #Diagram
-

Yearly Planning Details – Business Management and Timeline
#Company Introduction #Business Management #Diagram
-

Camera History Timeline Slide – Capturing the Flow of Time
#Company Introduction #Diagram #History
-

Adventure Company History 4 Color Connection Diagram
#Company Introduction #Business Strategy #Diagram
