Business History Connection Diagram – Company Growth Story
RJ0300059_6
- Last Update 05/04/2025
- File Size 1MB
- # of Slides 2
- File Format PPTX
- Slide Ratio 16:9
- Color
Keywords
- #Content-Based Slides
- #Design-Based Slides
- #Company Introduction
- #Diagram
- #History
- #Cluster
- #Chain Diagram
- #16:9
- #timeline diagram PowerPoint
- #connection diagram slide template
- #business history timeline
- #company growth diagram
- #milestone timeline presentation
- #how to create timeline diagram in PowerPoint
About the Product
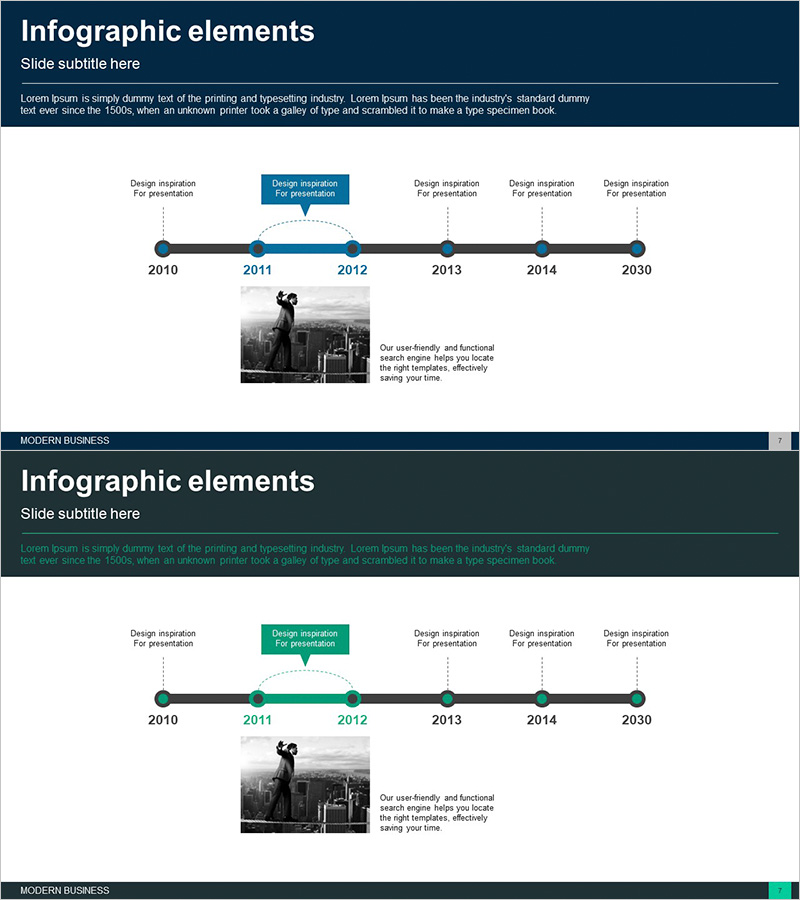
A timeline connection diagram PowerPoint slide that visualizes your company's growth journey across key milestones and events. This 2-slide template features a dark blue background with navy accent nodes and black connecting lines, displaying six chronological touchpoints with editable text fields for years and descriptions. The central timeline layout with vertically distributed information nodes makes it ideal for presenting business history, product launch timelines, and milestone achievements in investor pitches, company profiles, and annual reports. Each node is fully customizable to highlight your organization's evolution and strategic accomplishments in presentations.
Usage Points
-
Main Usage
Present your company's key events, product launches, and milestones in chronological order to tell a compelling business growth story. The timeline structure clearly shows your organization's evolution from inception to present, building credibility with investors, clients, and employees by visually demonstrating your track record of achievement.
-
How to Use
Enter years and event names in each node, then add detailed descriptions in the text areas. Adjust node colors and sizes to emphasize importance, and insert the slide into company introductions, annual reports, or investor presentations to highlight your business journey and strategic milestones.
-
Recommended For
Corporate communications managers, marketing strategists, investor relations professionals, and business development teams presenting company history, product evolution, or project timelines. Ideal for startups showcasing growth stages, enterprises highlighting major achievements, and teams explaining phased project implementation.
-
Slide Structure
2-slide template with 6 nodes arranged vertically around a central timeline axis. Each node includes year labels and editable text boxes for event descriptions. Slide 2 offers an alternate color scheme (dark green accents) for design flexibility. 16:9 widescreen format in PPTX with fully editable elements for customization.
Related Products
-

History Overlay Diagram – Company Introduction Slide
#Company Introduction #Diagram #History
-

Spade Shape Theme History Diagram – Emphasizing Company Development
#Company Introduction #Diagram #History
-

Business History Connection Diagram
#Company Introduction #Diagram #History
-

Business History Diagram – Visualizing Organizational Growth
#Company Introduction #Diagram #History
