Business History Connection Diagram
RJ0300050_3
- Last Update 05/01/2025
- File Size 1.8MB
- # of Slides 2
- File Format PPTX
- Slide Ratio 16:9
- Color
Keywords
About the Product
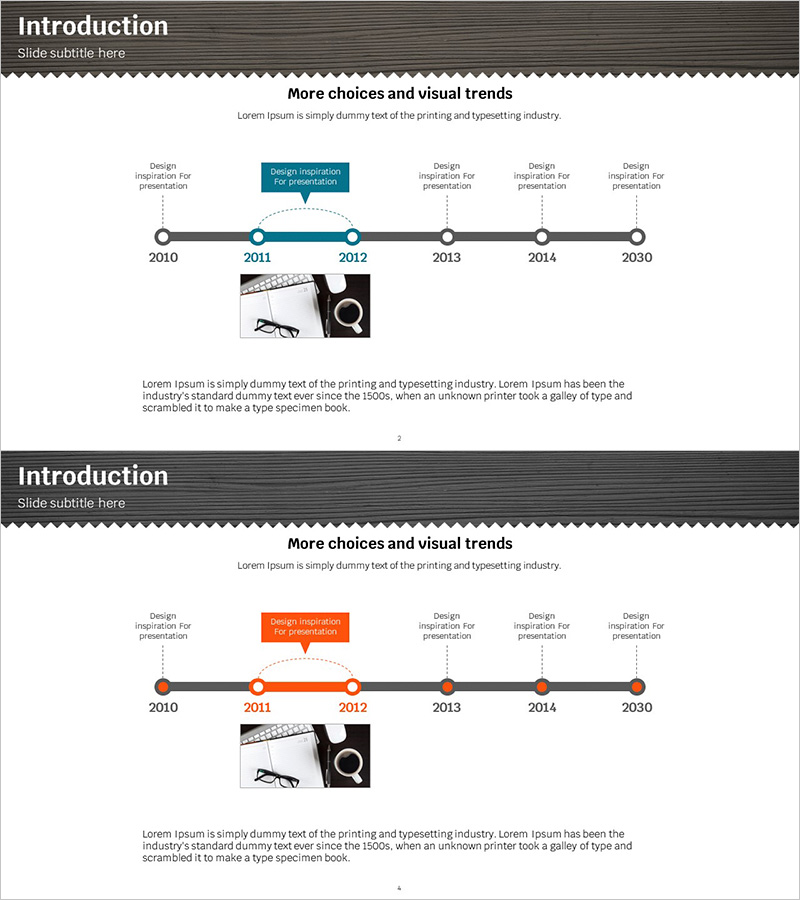
A timeline connection diagram PowerPoint slide that visualizes business history from 2010 to 2030. This presentation slide features a linear flow structure with 6 nodes, clearly expressing key milestones and design inspiration points for each year. The minimalist layout combines a gray header and white background with teal accent elements to enhance professionalism. This slide deck is ready to use for company introduction presentations, corporate history explanations, and growth journey sharing. The 16:9 widescreen format with 2-slide composition allows easy customization and editing for various business presentations.
Usage Points
-
Main Usage
This diagram is optimized for clearly communicating a company's history and growth trajectory in chronological order. Each year's milestone is represented as a node, enabling audiences to intuitively understand the company's development path. It strengthens credibility and professionalism in company introductions, corporate profile presentations, and investor briefings.
-
How to Use
Enter the year and key events at each timeline node to mark important company milestones. Use the teal accent box to highlight core achievements during specific periods. Enhance each stage's characteristics by adding images or icons, and provide background information with text descriptions for comprehensive storytelling.
-
Recommended For
Ideal for corporate executive and marketing team company introduction presentations, new employee onboarding materials, investor and partner company briefings, and annual business report company history sections. Effective for startups sharing growth stories and large corporations explaining historical backgrounds.
-
Slide Structure
Linear timeline structure composed of 6 circular nodes. Each node displays the year, with text boxes above for key events. The teal accent box emphasizes core content during specific periods, while dotted connector lines express continuity between nodes. An image area at the bottom allows visual supplementation and customization.
Related Products
-

History Road Diagram – A Cluster Diagram Ideal for Company Introduction
#Company Introduction #Diagram #History
-

History Folder Shape Diagram - Optimized for Company Introduction
#Company Introduction #Product/Service Introduction #Diagram
-

History Flag Shape Diagram - Company Growth and Vision
#Company Introduction #Diagram #History
-

Silhouette History Diagram – Visualizing Evolution
#Company Introduction #Diagram #Other
