Construction Work Puzzle Diagram – Cluster-Based Structure
RJ0900011_9
- Last Update 08/19/2025
- File Size 0.2MB
- # of Slides 2
- File Format PPTX
- Slide Ratio 16:9
- Color
Keywords
- #Content-Based Slides
- #Design-Based Slides
- #Product/Service Introduction
- #Business Introduction
- #Diagram
- #Composition
- #Technological Status
- #Cluster
- #Chain Diagram
- #16:9
- #cluster diagram PowerPoint
- #puzzle diagram slide
- #construction work process
- #interconnected workflow diagram
- #8-node structure slide
About the Product
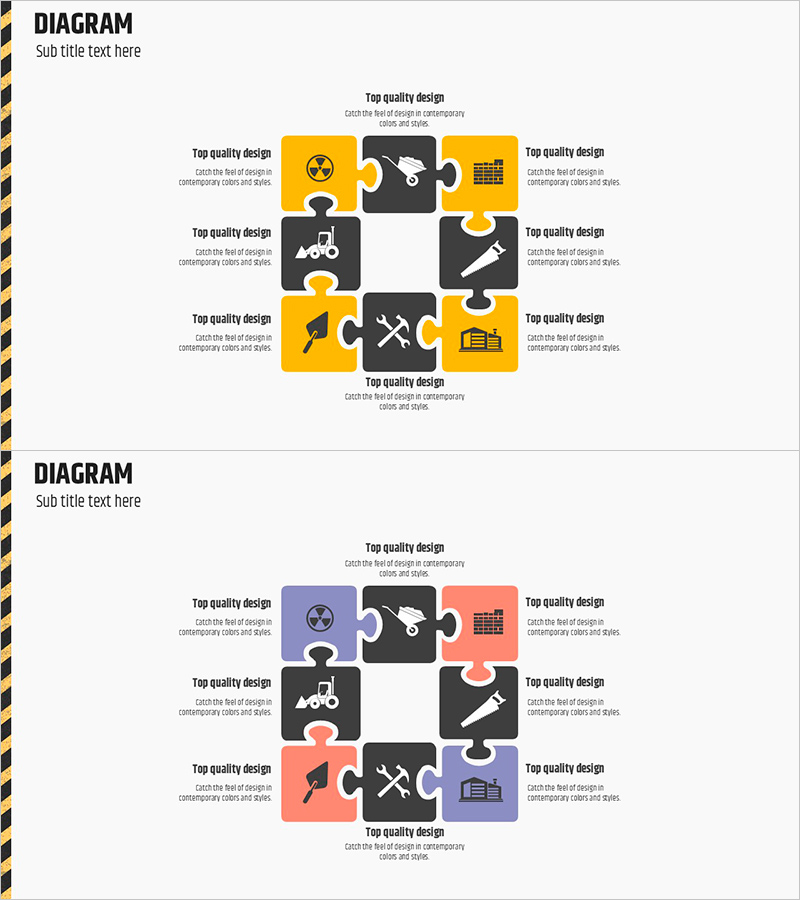
A cluster-based puzzle diagram PowerPoint slide that visualizes construction project work stages and interconnected relationships using 8 puzzle pieces. The design features a central black core node with yellow and black puzzle components arranged in a radial pattern, simultaneously expressing both the independence and interdependence of each work area. This 2-slide set (16:9 widescreen format) is ready to use for process explanations, organizational structures, workflow diagrams, and various presentation scenarios in construction, technology, and business sectors.
Usage Points
-
Main Usage
Intuitively expresses the interconnected relationships between work stages in construction, technology, and business projects. The radial structure expanding from a central core node to 8 surrounding work areas emphasizes both independence and integration. Applicable to process explanations, organizational structures, workflow diagrams, technical architecture, and diverse presentation contexts.
-
How to Use
Enter the project name or topic in the 'Construction Work' text area at the top of the slide. Fill in each puzzle piece's text box with specific work content, responsible department, and timeline. Reorganize colors—yellow pieces for primary tasks, black pieces for support tasks—to express priorities and dependencies.
-
Recommended For
Recommended for construction companies' project planning presentations, technology teams' system architecture explanations, business departments' workflow sharing, consulting firms' strategy reports, and educational institutions' project management training materials.
-
Slide Structure
2-slide set. First slide features 8 yellow and black puzzle pieces arranged radially around a central black core node. Second slide offers color variations (yellow, black, orange, purple mix) for flexible category differentiation. Each piece includes editable text input areas for customization.
Related Products
-

Data Analysis Radial Graph for Performance Visualization – Trust and Professionalism
#Product/Service Introduction #Business Introduction #Diagram
-

Key Ingredient Analysis Slide – Product/Service Value Proposition
#Product/Service Introduction #Diagram #Features
-

Analysis of Human Response to the Vaccine – Insights into Health
#Product/Service Introduction #Diagram #Features
-

Diagram Slide Introducing Essential Travel Items
#Product/Service Introduction #Diagram #Features
