Space Industry Analysis Circular Graph
RJ0700013_18
- Last Update 07/25/2025
- File Size 1.3MB
- # of Slides 2
- File Format PPTX
- Slide Ratio 16:9
- Color
Keywords
- #Content-Based Slides
- #Design-Based Slides
- #Product/Service Introduction
- #Market and Competitor Analysis
- #Diagram
- #Graph
- #Composition
- #Market Analysis
- #Cluster
- #Circles
- #Closed Cluster Diagram
- #Pie Chart
- #16:9
- #pie chart PowerPoint slide
- #circular graph template
- #market analysis chart
- #data visualization slide
- #space industry presentation
- #proportion chart download
About the Product
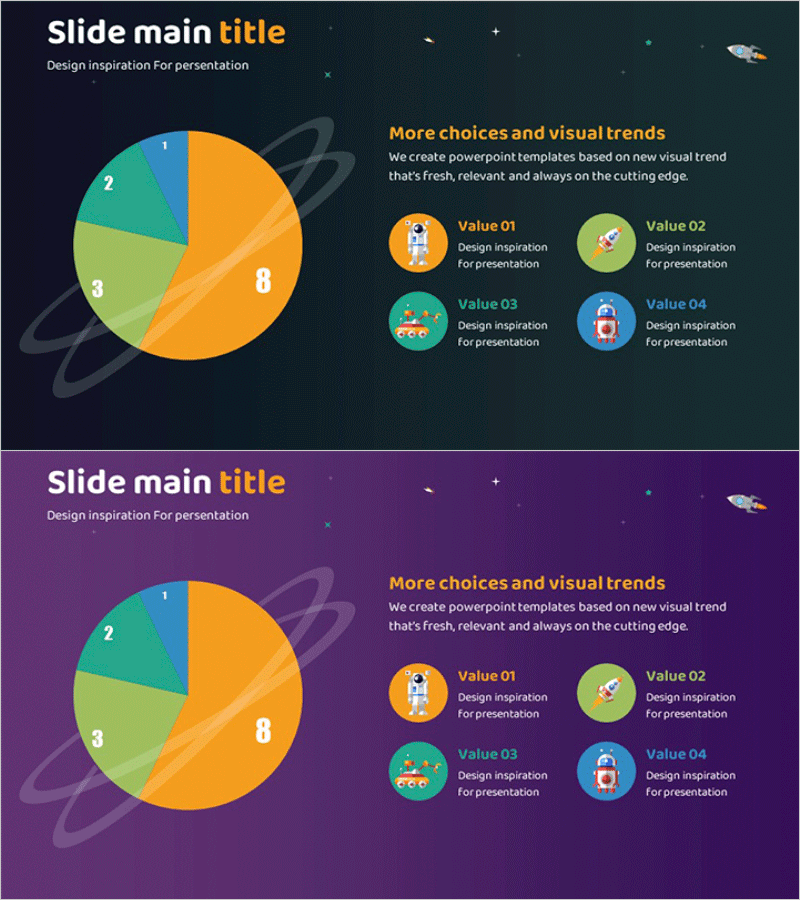
A PowerPoint slide featuring an 8-segment pie chart designed for space industry market analysis presentations. The chart uses vibrant colors including orange, teal, and lime green to clearly distinguish each market segment's proportion. This 2-slide set offers two color variations: dark navy background on the first slide and deep purple on the second, each paired with four circular icon elements for highlighting key data points. The slide template is ready to use for aerospace, space exploration, and space technology presentations, enabling quick customization with your own data and insights.
Usage Points
-
Main Usage
Visualize space industry market size, sector composition, and segment distribution using a pie chart to communicate data-driven insights to your audience. Ideal for investor presentations, industry analysis reports, and technology seminars where complex numerical information needs to be presented intuitively.
-
How to Use
Enter industry sector names and percentage values into each pie chart segment, then add your key points (Value 01–04) in the four icon boxes on the right. Choose between the two dark background color variations based on your presentation theme and audience context.
-
Recommended For
Space and aerospace industry analysts, investors, technology marketers, academic presenters, and research institutions explaining market size, competitive landscape, and technology distribution. Particularly effective for multi-sector comparison in industry analysis materials.
-
Slide Structure
Two identical slides with dark backgrounds (navy and purple): left side features an 8-segment pie chart in orange, teal, lime green, and blue; right side displays four circular icon boxes (Value 01–04) for key points. Includes title area and descriptive text space. 16:9 widescreen PPTX format.
Related Products
-

Health Checkup Data Analysis Circular Graph – Effective Business Data Visualization
#Product/Service Introduction #Market and Competitor Analysis #Diagram
-

Business Analysis Pie Chart
#Product/Service Introduction #Market and Competitor Analysis #Graph
-

Market Analysis Pie Chart – Vibrant Visualization in Contemporary Colors
#Product/Service Introduction #Market and Competitor Analysis #Diagram
-

Animal Trait Distribution Pie Chart – Market and Competitor Analysis
#Market and Competitor Analysis #Diagram #Graph
