Business Analysis Pie Chart
RJ0300033_12
- Last Update 04/27/2025
- File Size 1.9MB
- # of Slides 2
- File Format PPTX
- Slide Ratio 16:9
- Color
Keywords
- #Content-Based Slides
- #Design-Based Slides
- #Product/Service Introduction
- #Market and Competitor Analysis
- #Graph
- #Composition
- #Market Analysis
- #Circles
- #Pie Chart
- #16:9
- #pie chart PowerPoint slide
- #pie graph template
- #business analysis chart
- #market share visualization
- #data visualization slide
- #pie chart download
- #how to create pie chart in PowerPoint
About the Product
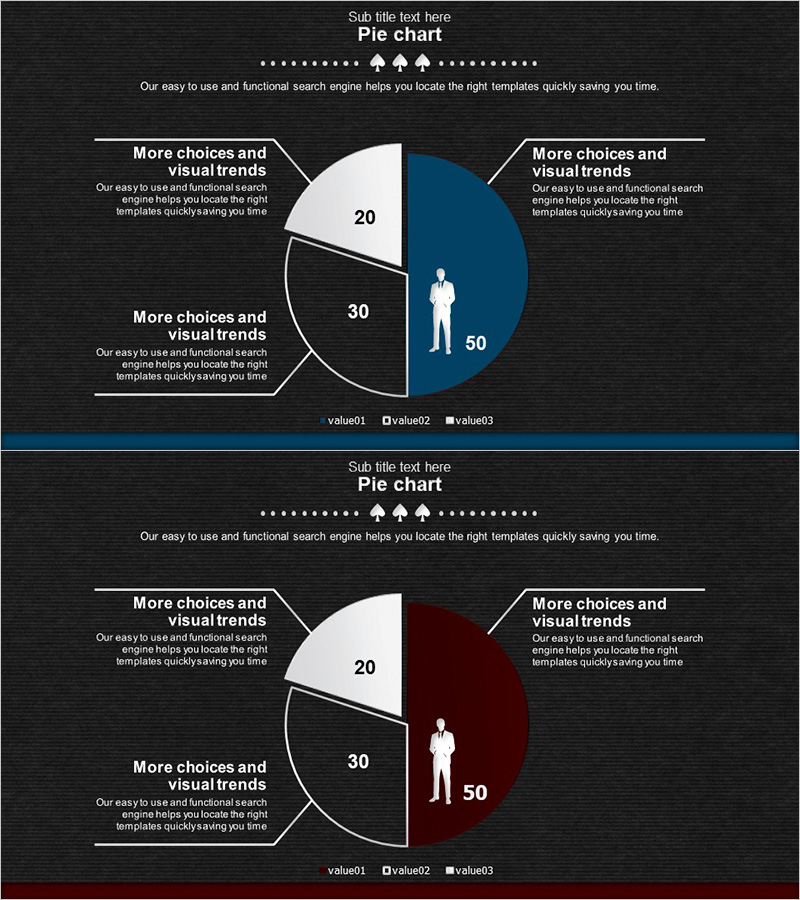
A professional pie chart PowerPoint slide designed for business analysis and market research presentations. The slide features a three-segment pie chart with white, dark blue, and wine red color segments on a dark background, displaying numerical data (20, 30, 50) with accompanying text callouts. This template is ideal for presenting market share, competitive analysis, customer segmentation, and other ratio-based business metrics. The two-slide set provides flexibility for comparing multiple analysis items, while the 16:9 widescreen format ensures compatibility with modern presentation environments. Fully editable PPTX format allows you to customize data values, labels, and descriptions to match your specific business analysis needs.
Usage Points
-
Main Usage
Used in business analysis reports, marketing presentations, investor pitch decks, and strategic planning meetings to clearly visualize ratio-based data and compositional information. Particularly effective for presenting market share distribution, customer segmentation analysis, competitive positioning, and product mix composition across three key categories.
-
How to Use
Simply replace the numerical values and labels on the pie chart segments with your own data. The color-coded segments make it easy for audiences to distinguish between different categories. Add or modify the callout text boxes on either side to provide context and insights. The two-slide layouts offer flexibility for presenting multiple analysis scenarios sequentially.
-
Recommended For
Marketing managers, business executives, management consultants, data analysts, and business intelligence professionals presenting analytical findings. Ideal for market research presentations, competitive analysis reports, financial summaries, customer analysis briefings, and strategic business reviews.
-
Slide Structure
Two-slide template featuring a centered three-segment pie chart with left and right callout text boxes. The pie chart is divided into three color-coded sections: white (20%), dark blue (50%), and wine red (30%), each with numerical labels and icons. Presented in 16:9 widescreen format as a fully editable PPTX file.
Related Products
-

Space Industry Analysis Circular Graph
#Product/Service Introduction #Market and Competitor Analysis #Diagram
-

Data Market Analysis Circle Chart – Insightful Visuals
#Product/Service Introduction #Market and Competitor Analysis #Graph
-

Sugar Type Analysis Pie Chart
#Product/Service Introduction #Market and Competitor Analysis #Graph
-

Aerospace Industry Technology Status Graph – Market Dominance Data Analysis
#Product/Service Introduction #Market and Competitor Analysis #Graph
