Competitor Comparison Analysis Bar Graph – Market Insights
RJ0300049_10
- Last Update 05/01/2025
- File Size 1.6MB
- # of Slides 2
- File Format PPTX
- Slide Ratio 16:9
- Color
Keywords
About the Product
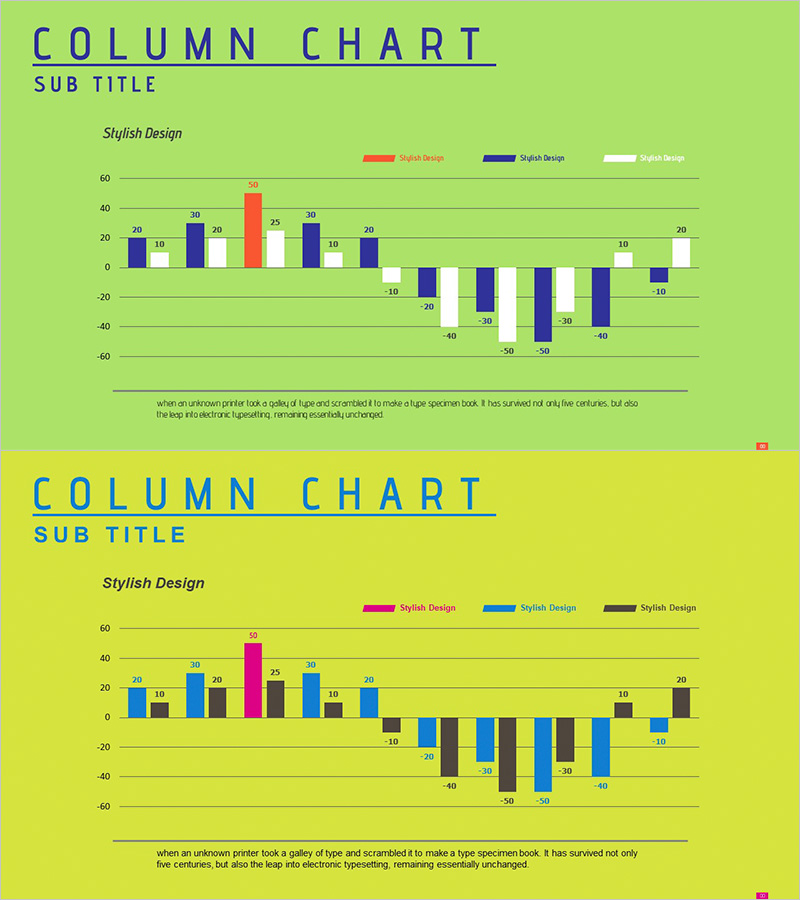
A clustered bar chart PowerPoint slide designed for competitor comparison and market analysis. Set against a lime green background, it features three data series in red, blue, and white vertical bars that can display both positive and negative values simultaneously. Each data point is clearly labeled with numerical values, making competitive positioning and market insights immediately apparent. This 2-slide template is ready to use in presentations requiring multi-series data comparison and competitive benchmarking.
Usage Points
-
Main Usage
Visualize multiple competitor metrics—market share, sales performance, customer satisfaction scores—simultaneously to establish clear competitive positioning. The dual-axis capability (positive and negative values) enables intuitive comparison of growth trends and relative performance gaps.
-
How to Use
Deploy in business strategy presentations, market analysis reports, and investor pitch decks within the competitive landscape section. The color-coded bars and numerical labels allow audiences to quickly grasp performance differentials across competitors and time periods.
-
Recommended For
Marketing strategists, business development teams, and C-suite executives preparing competitive analysis materials. Ideal for market research presentations, product performance benchmarking, customer satisfaction comparisons, and quarterly competitive reviews.
-
Slide Structure
Two slides with lime green background. Each slide contains a clustered bar chart with 8–10 items on the horizontal axis, value range from -60 to 60 on the vertical axis. Three data series (red, blue, white bars) are grouped beneath each category, with legend and subtitle areas included.
Related Products
-

Line Graph and Clustered Column Graph – Essential for Competitor Analysis
#Market and Competitor Analysis #Graph #Competitor Analysis
-

Market Competitor Analysis with Clustered Vertical Bar Chart
#Market and Competitor Analysis #Graph #Competitor Analysis
-

Grouped Bar Chart for Learning Categories
#Market and Competitor Analysis #Graph #Competitor Analysis
-

Comparative Analysis Vertical Chart – Market and Competitor Analysis
#Market and Competitor Analysis #Graph #Competitor Analysis
