Note Illustration Theme Chart – Market Analysis and Competitor Insights Tool
RJ0300045_34
- Last Update 04/30/2025
- File Size 0.2MB
- # of Slides 2
- File Format PPTX
- Slide Ratio 16:9
- Color
Keywords
- #Content-Based Slides
- #Design-Based Slides
- #Market and Competitor Analysis
- #Diagram
- #Graph
- #Competitor Analysis
- #Market Analysis
- #Table
- #Column
- #Standard Table
- #Grouped Column
- #16:9
- #horizontal bar chart PowerPoint
- #vertical bar chart slide
- #grouped bar chart template
- #market analysis PowerPoint slide
- #data comparison presentation
- #competitive analysis chart download
About the Product
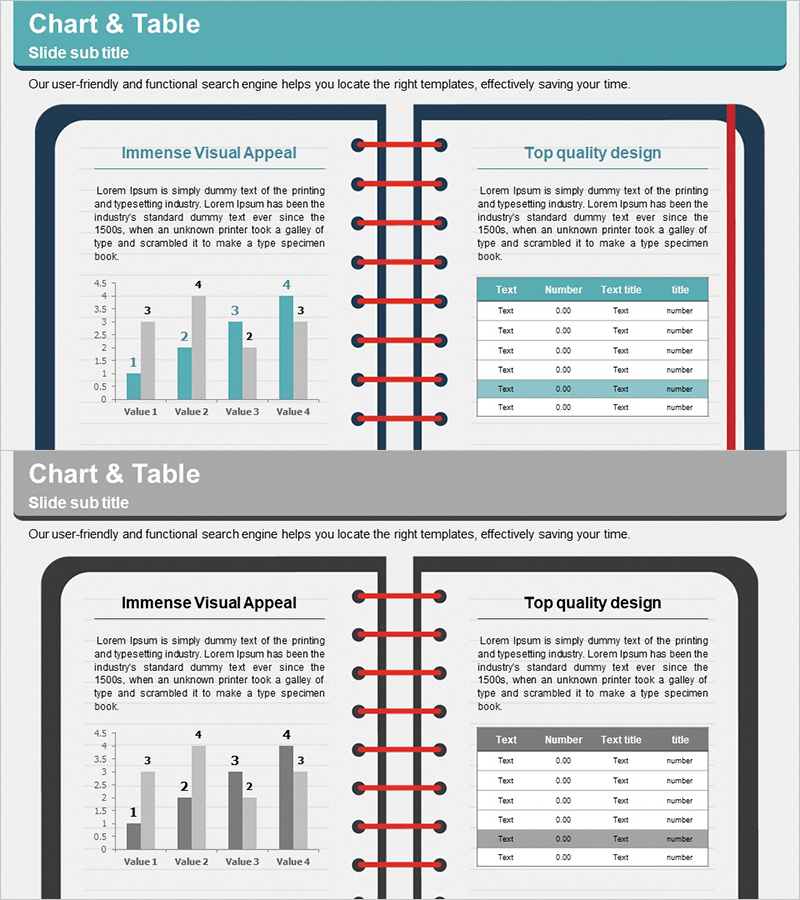
A 2-slide PowerPoint presentation designed for market analysis and competitive benchmarking. This slide deck combines horizontal and vertical grouped bar charts to accommodate diverse data comparison scenarios. The teal and gray color palette creates a professional business atmosphere, with clear separation between text and chart areas for efficient information delivery. The structure visualizes four data items across multiple metrics, making it immediately applicable to marketing plans, business reports, and strategic presentations. Each slide is fully editable and ready for customization with your own data and branding.
Usage Points
-
Main Usage
Visualize and compare four data items across multiple dimensions using both horizontal and vertical grouped bar charts. The left text area accommodates analysis narrative while the right chart area displays quantitative metrics, creating a balanced layout ideal for presenting market data, competitive positioning, sales performance, and customer satisfaction metrics simultaneously.
-
How to Use
Insert this slide into business reports, marketing plans, strategy presentations, and investor pitch decks in the market analysis or competitive comparison sections. Replace the placeholder text and chart data with your own content, and adjust colors and fonts to match your corporate branding. The 2-slide format allows you to present multiple analysis topics in sequence.
-
Recommended For
Marketing professionals, business analysts, strategy consultants, executives, and data-driven decision makers. Particularly effective for presenting market research findings, competitive benchmarking results, sales performance analysis, and customer satisfaction survey outcomes.
-
Slide Structure
2-slide layout with each slide divided into left text area (title and description) and right chart area. The chart section features a horizontal grouped bar chart (upper) and vertical grouped bar chart (lower) displaying four data items in dual visualization formats. Color scheme: teal, gray, and white; includes data labels; 16:9 widescreen format.
Related Products
-

Performance Analysis Table Slide – Market and Competitor Analysis
#Market and Competitor Analysis #Diagram #Graph
-

Table Chart & Clustered Column Graph – Market and Competitor Analysis
#Market and Competitor Analysis #Diagram #Graph
-

Competitor Comparison Analysis Graph - A Tool for Effective Market Analysis
#Market and Competitor Analysis #Diagram #Graph
-

3D Printing Market Analysis Graph
#Market and Competitor Analysis #Diagram #Graph
