Business Competitor Comparison Analysis Graph – Effective Investment and Strategy Development
RJ0300087_8
- Last Update 05/13/2025
- File Size 0.1MB
- # of Slides 2
- File Format PPTX
- Slide Ratio 16:9
- Color
Keywords
- #Content-Based Slides
- #Design-Based Slides
- #Market and Competitor Analysis
- #Graph
- #Competitor Analysis
- #Market Analysis
- #Column
- #Grouped Column
- #16:9
- #grouped bar chart PowerPoint
- #competitor comparison analysis slide
- #horizontal bar graph template
- #vertical bar chart PPT
- #data visualization slide
- #business analysis chart PowerPoint
About the Product
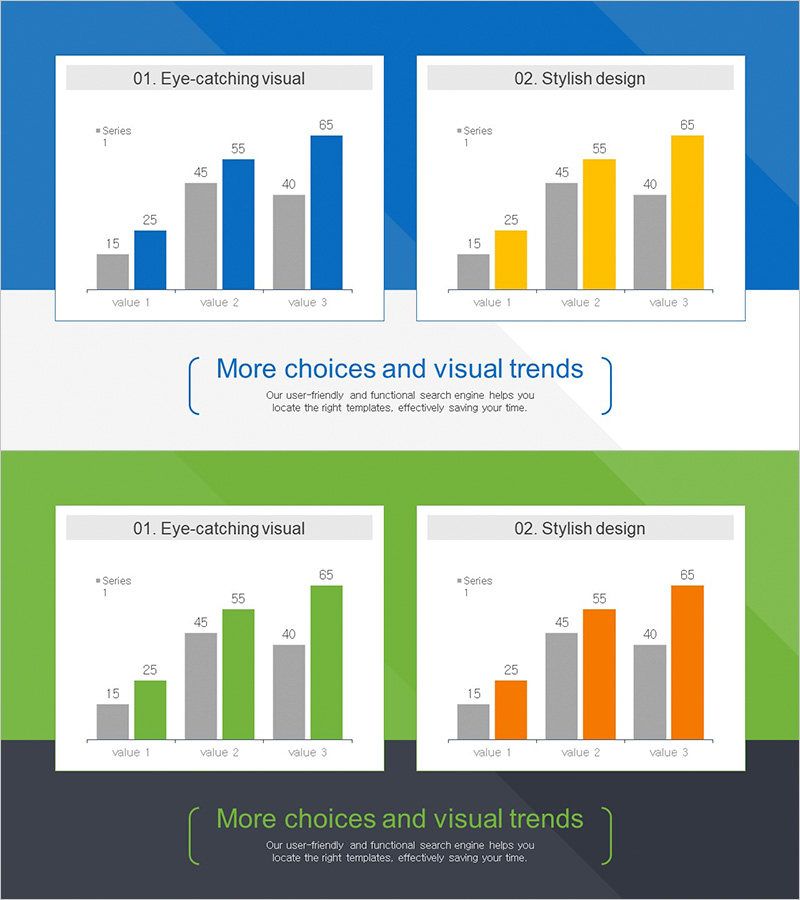
A 2-slide grouped bar chart PowerPoint presentation designed for business competitor comparison and market analysis. This slide deck includes both horizontal and vertical bar chart layouts to accommodate various data visualization scenarios. The charts feature three color series—blue, yellow, and orange—enabling clear distinction between data categories while effectively displaying numerical comparisons across three items. Ideal for market analysis, competitive benchmarking, investment strategy presentations, and business development discussions.
Usage Points
-
Main Usage
This slide is designed to clearly compare and visualize numerical data when analyzing competitors, conducting market research, or developing investment strategies. The grouped bar format allows intuitive comparison of three items across multiple metrics, with both horizontal and vertical layout options to suit different presentation contexts.
-
How to Use
Slide 1 presents a horizontal grouped bar chart, while Slide 2 displays a vertical grouped bar chart. Replace the sample values (15, 25, 45, 55, 40, 65) with your actual data and update the legend and axis labels with competitor names and metric titles. The default blue, yellow, and orange color scheme can be retained or customized to match your corporate branding.
-
Recommended For
Ideal for executives, marketing teams, strategy planners, and sales professionals presenting competitor analysis, market share comparisons, product performance benchmarks, and pricing strategy evaluations. Suitable for investor presentations, business plan pitches, quarterly performance reviews, and strategic planning sessions where data credibility is essential.
-
Slide Structure
Two-slide layout with Slide 1 featuring a horizontal grouped bar chart (3 series, 3 items) and Slide 2 displaying a vertical grouped bar chart (3 series, 3 items). Each slide includes a title area, chart area, and legend area, optimized for 16:9 widescreen format.
Related Products
-

Line Graph and Clustered Column Graph – Essential for Competitor Analysis
#Market and Competitor Analysis #Graph #Competitor Analysis
-

Earth Analysis Bundle Vertical Bar Graph – Market and Competitor Analysis
#Market and Competitor Analysis #Graph #Competitor Analysis
-

Market Competitor Analysis with Clustered Vertical Bar Chart
#Market and Competitor Analysis #Graph #Competitor Analysis
-

Comparative Analysis Vertical Chart – Market and Competitor Analysis
#Market and Competitor Analysis #Graph #Competitor Analysis
