Competitor and Market Analysis Slide Design - Harmony of Blue and Yellow
RJ0400008_18
- Last Update 05/19/2025
- File Size 2.1MB
- # of Slides 2
- File Format PPTX
- Slide Ratio 16:9
- Color
Keywords
- #Content-Based Slides
- #Design-Based Slides
- #Market and Competitor Analysis
- #Diagram
- #Graph
- #Competitor Analysis
- #Market Analysis
- #Table
- #Column
- #Standard Table
- #Column Chart
- #16:9
- #column chart PowerPoint slide
- #market analysis presentation template
- #competitor analysis chart
- #data table slide design
- #business comparison PowerPoint
About the Product
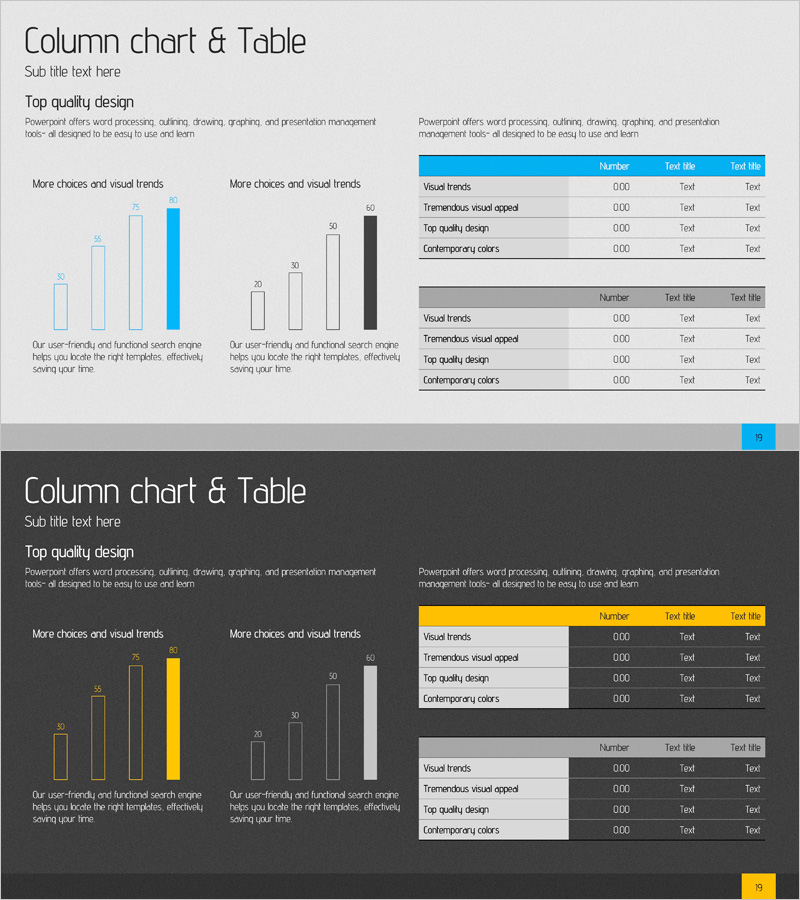
A 2-slide PowerPoint presentation set designed for competitor and market analysis. The blue-themed slide features two column charts with 4 data points each, paired with detailed data tables for comprehensive numerical comparison. The yellow-themed slide mirrors the same structure with contrasting colors, enabling scenario comparison and alternative analysis. Both slides are fully editable and ready to integrate into business presentations, strategic reports, and investor pitches. The layout balances visual impact with data clarity, making complex market insights immediately understandable.
Usage Points
-
Main Usage
Visualize competitor and market analysis data to support strategic planning meetings, investor presentations, and business reports. Column charts enable clear numerical comparison across categories, while integrated data tables provide detailed metrics for evidence-based decision-making and stakeholder confidence.
-
How to Use
Edit chart data directly in PowerPoint's data table feature to update values and automatically refresh the column charts. Use the blue slide for baseline analysis and the yellow slide for alternative scenarios or competitive benchmarking. Customize table entries to match your specific metrics and reporting requirements.
-
Recommended For
Strategy teams, marketing departments, business analysts, management consultants, and investor relations professionals conducting competitive analysis, market assessment, and performance benchmarking. Ideal for C-suite presentations, board meetings, and strategic planning sessions requiring quantitative data visualization.
-
Slide Structure
Each slide contains a title section, two column charts displaying 4 data points with contrasting color emphasis, and two corresponding data tables with 3 columns (Number, Text title, Text title). The left chart uses muted tones while the right chart features bold accent colors for visual hierarchy and data emphasis.
Related Products
-

Comparative Analysis Bar Graph & Table – Optimized for Market and Competitor Analysis
#Market and Competitor Analysis #Diagram #Graph
-

Comparative Analysis Split Bar Graph – Reliable Market Analysis
#Market and Competitor Analysis #Graph #Competitor Analysis
-

Stylish Bar Chart Slide Design
#Market and Competitor Analysis #Diagram #Graph
-

Cement Theme Bar Graph & Table
#Market and Competitor Analysis #Diagram #Graph
