Vertical Bar Standard Color Chart for Market Analysis – Market and Competitor Analysis
RJ0500017_6
- Last Update 06/11/2025
- File Size 2MB
- # of Slides 2
- File Format PPTX
- Slide Ratio 16:9
- Color
Keywords
- #Content-Based Slides
- #Design-Based Slides
- #Market and Competitor Analysis
- #Graph
- #Competitor Analysis
- #Market Analysis
- #Column
- #Column Chart
- #16:9
- #vertical bar chart PowerPoint
- #column chart slide template
- #market analysis presentation
- #competitor analysis PPT
- #data comparison slide
- #how to create bar chart in PowerPoint
About the Product
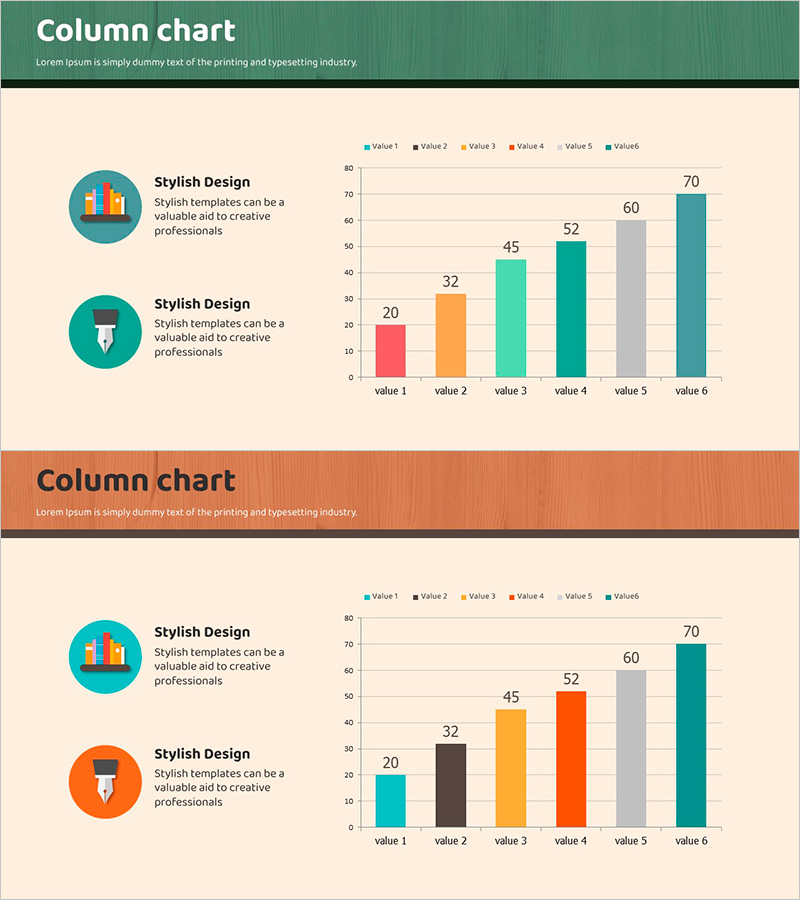
A vertical bar chart PowerPoint slide optimized for market analysis and competitor comparison. This presentation template visualizes six data series with distinct color coding, enabling clear numerical representation across multiple categories. The color palette combines teal, orange, mint green, and gray tones to differentiate data points intuitively. The left side features an icon and descriptive text area for analytical context, while the right side emphasizes the chart visualization. This slide deck is ready to use in business reports, strategic presentations, pitch decks, and competitive analysis documents.
Usage Points
-
Main Usage
Compares multiple data points such as market size, growth rates, competitor revenue, and customer satisfaction scores. Six distinct bars enable clear numerical differentiation and help audiences grasp comparative insights during presentations.
-
How to Use
Enter analysis title and description in the left icon area, then update chart values with actual data. Colors can remain as designed or be customized to match corporate branding. Use the legend to clarify what each series represents.
-
Recommended For
Marketing professionals, strategy teams, and executives presenting market insights, competitive positioning, and performance metrics. Ideal for business plans, quarterly reports, investor presentations, and client proposals requiring data-driven storytelling.
-
Slide Structure
Two-slide set. First slide features a teal header with title, left-side circular icon (chart symbol) with text area, and right-side vertical bar chart with 6 series (values 1–6, ranging 20–70). Second slide uses an orange header variant with identical chart layout for design flexibility.
Related Products
-

Competitor and Market Analysis Slide Design - Harmony of Blue and Yellow
#Market and Competitor Analysis #Diagram #Graph
-

Comparative Analysis Vertical Bar Graph for Market Insights
#Market and Competitor Analysis #Graph #Other
-

Vertical Bar Graph for Market and Competitor Analysis – Professional Data Visuals
#Market and Competitor Analysis #Graph #Competitor Analysis
-

Market Analysis Circular Bar Graph – Clarity in Information Delivery
#Market and Competitor Analysis #Graph #Competitor Analysis
