Concise Analysis Column Graph & Table Slide
RJ0400016_13
- Last Update 05/21/2025
- File Size 0.3MB
- # of Slides 2
- File Format PPTX
- Slide Ratio 16:9
- Color
Keywords
About the Product
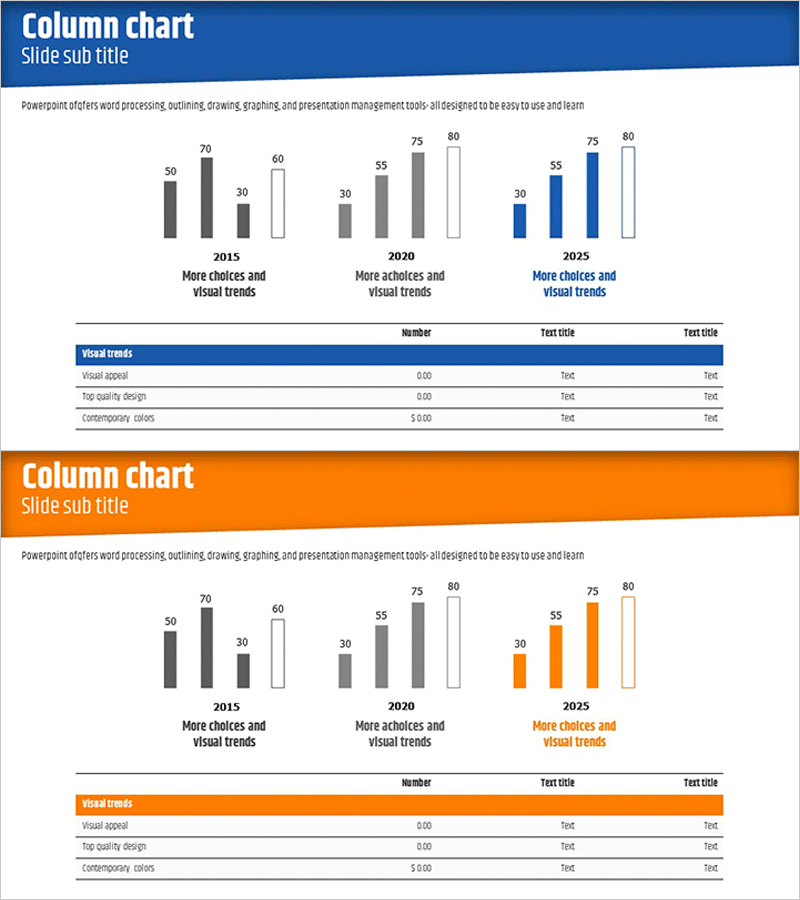
A PowerPoint slide that visualizes three-year data trends (2015, 2020, 2025) using vertical column charts and presents detailed information in a data table below. The slide features dark gray, white, and blue color schemes, making it ideal for market analysis, competitive benchmarking, and performance reporting presentations. The dual-structure design—combining bar height visualization with tabular data—enables audiences to grasp numerical changes at a glance while accessing detailed metrics. Available in 16:9 widescreen PPTX format, fully compatible with modern PowerPoint versions, with editable colors, values, and text fields for customization.
Usage Points
-
Main Usage
This dual-structure slide combines vertical column charts for visual data comparison with a data table for detailed metrics. Optimized for quantitative presentations such as market size trends, competitor performance analysis, and departmental KPI reviews, enabling audiences to instantly recognize numerical patterns while accessing supporting details.
-
How to Use
Insert into business reports, investor presentations, marketing strategy decks, and quarterly performance reviews in the data comparison section. Simply input your figures into the chart bars and table cells for immediate presentation use. Color schemes can be adjusted to match organizational branding guidelines.
-
Recommended For
Recommended for finance and planning teams presenting performance metrics, sales teams explaining market conditions, executive briefings, academic presentations, and consulting proposals. Ideal for any presentation scenario requiring quantitative evidence and credible data visualization.
-
Slide Structure
Slide 1: Two vertical column chart sets in dark gray, white, and blue color palette (3-year data: 2015, 2020, 2025; 2–3 comparison items per year). Slide 2: Orange header background with identical column chart structure plus data table below (Visual trends row with 3 data columns). Total 2 slides, 16:9 PPTX format.
Related Products
-

Competitor and Market Analysis Slide Design - Harmony of Blue and Yellow
#Market and Competitor Analysis #Diagram #Graph
-

Comparative Analysis Bar Graph & Table – Optimized for Market and Competitor Analysis
#Market and Competitor Analysis #Diagram #Graph
-

Global Target Market Analysis Graph
#Market and Competitor Analysis #Diagram #Graph
-

Business Market Analysis Bar Graph – Visualizing Competitive Analysis
#Market and Competitor Analysis #Diagram #Graph
