Subdivision Graph for Market Analysis – Competitor Insights
RJ0300049_8
- Last Update 05/01/2025
- File Size 1.6MB
- # of Slides 2
- File Format PPTX
- Slide Ratio 16:9
- Color
Keywords
- #Content-Based Slides
- #Design-Based Slides
- #Market and Competitor Analysis
- #Graph
- #Competitor Analysis
- #Market Analysis
- #Horizontal Bar
- #Segmented Horizontal Bar
- #16:9
- #subdivision bar chart PowerPoint
- #horizontal bar graph template
- #market analysis slide
- #competitor comparison chart
- #data visualization presentation
About the Product
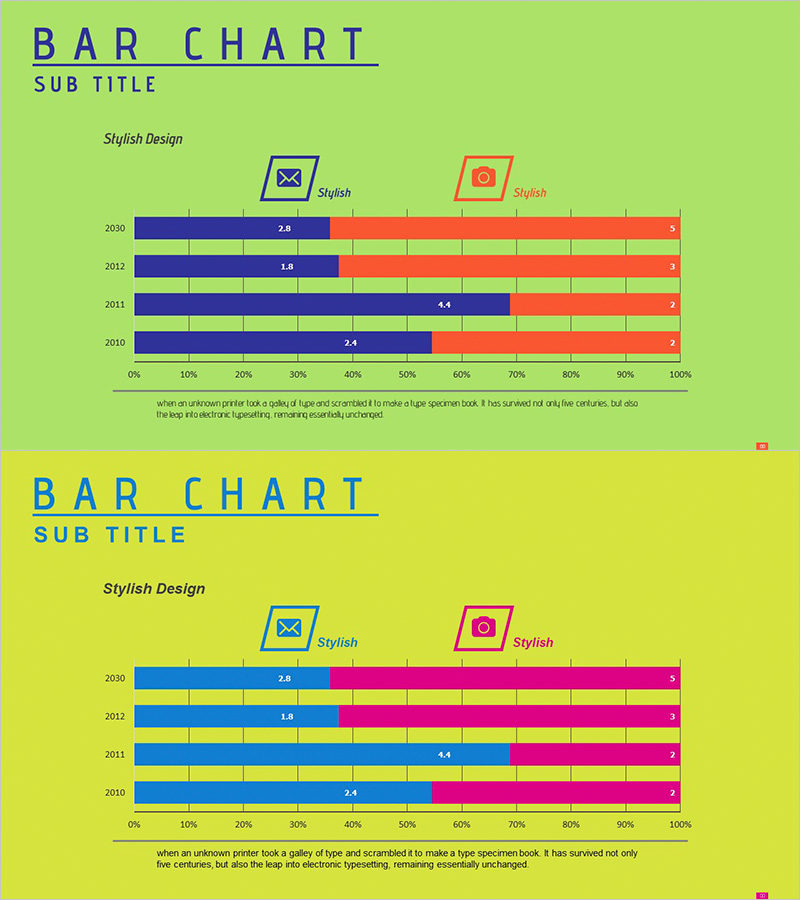
A horizontal bar chart PowerPoint slide optimized for market analysis and competitor comparison. The design uses lime green, blue, and orange color coding to clearly distinguish two data series across four time periods (2010–2030). Each bar includes numeric labels for precise data communication, and icon legends enable intuitive category identification. The slide structure supports side-by-side comparison of market share, competitive positioning, and performance trends. Ready to embed in business presentations, quarterly reports, and strategic planning decks.
Usage Points
-
Main Usage
Compare two data series across multiple time periods or categories to highlight market share, competitive advantage, and performance gaps. The lime green and orange color contrast emphasizes the difference between series, while numeric labels ensure accurate data interpretation.
-
How to Use
Insert into business reports, marketing strategy presentations, and investor pitch decks within the competitive analysis or performance review section. Use bar length and color to convey relative positioning, and leverage the icon legend to clarify category meanings.
-
Recommended For
Marketing managers, strategy teams, and executives presenting competitive analysis, market entry strategies, and quarterly performance comparisons. Ideal for consulting reports, business plans, and investor presentations.
-
Slide Structure
Two-slide set. Slide 1: lime green background with blue and orange 2-series bars across 4 rows (2010–2030), numeric labels, icon legend, and descriptive text. Slide 2: yellow background with blue and magenta 2-series bars, same row structure, labels, and legend format.
Related Products
-

Comparative Analysis Graph – Optimal Tool for Market and Competitor Analysis
#Market and Competitor Analysis #Graph #Competitor Analysis
-

Segmented Bar Graph for Market and Competitor Analysis
#Market and Competitor Analysis #Graph #Competitor Analysis
-

Segmented Graph of Learning Goal Achievement – Market and Competitor Analysis
#Market and Competitor Analysis #Graph #Competitor Analysis
-

Market Analysis Bar Graph – Effective Visualization for Competitor Analysis
#Market and Competitor Analysis #Graph #Competitor Analysis
