Service System Analysis Graph – Market and Competitor Analysis
RJ0400055_18
- Last Update 06/01/2025
- File Size 14.7MB
- # of Slides 2
- File Format PPTX
- Slide Ratio 16:9
- Color
Keywords
- #Content-Based Slides
- #Design-Based Slides
- #Market and Competitor Analysis
- #Graph
- #Competitor Analysis
- #Market Analysis
- #Horizontal Bar
- #Segmented Horizontal Bar
- #16:9
- #horizontal bar chart PowerPoint
- #market analysis slide template
- #competitor analysis graph
- #stacked bar chart
- #data comparison PowerPoint slide
About the Product
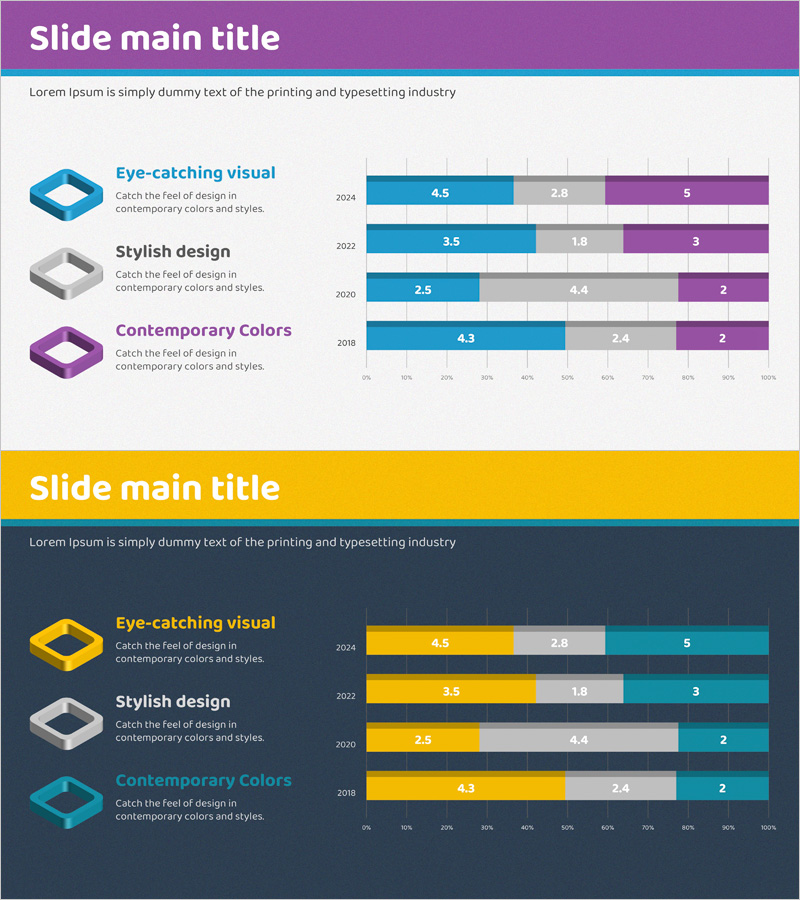
A horizontal bar chart PowerPoint slide designed for service system analysis and market comparison. Ideal for visualizing market analysis, competitor benchmarking, and performance metrics across multiple data series. Features a 4-item stacked bar chart in blue, gray, and purple tones with 3–5 data series per item displayed across years. Clear numerical labels on each segment enable immediate presentation use. Includes 2 slides in 16:9 widescreen format with complementary color schemes for versatile deck integration.
Usage Points
-
Main Usage
Visualize quantitative data for service system analysis, market size comparison, competitor performance benchmarking, and year-over-year trends. Multi-series stacked bars enable simultaneous comparison of multiple data points across categories, ideal for analytical presentations.
-
How to Use
Insert into business plans, marketing proposals, quarterly performance reports, and market analysis sections. Edit numerical values and category labels directly in the slide master to reflect your data. Use during presentations to explain each bar segment and guide audience understanding of comparative metrics.
-
Recommended For
Marketing managers, business strategists, financial analysts, consultants, and data-driven decision makers. Effective for presenting market research findings, competitive analysis, performance evaluations, and multi-year trend comparisons.
-
Slide Structure
2-slide set. Slide 1: Purple header background with 4-item horizontal stacked bar chart (3–5 series per item). Slide 2: Yellow header background with identical chart structure in dark tones. Numerical labels on each bar segment, 0–100% scale axis, clear legend and category labels.
Related Products
-

Market Analysis Bar Graph – Effective Visualization for Competitor Analysis
#Market and Competitor Analysis #Graph #Competitor Analysis
-

Body Organ Analysis Subdivision Graph - Market and Competitor Comparison
#Market and Competitor Analysis #Graph #Competitor Analysis
-

Space Industry Market Analysis Bar Graph – Providing Strategic Insights
#Market and Competitor Analysis #Graph #Competitor Analysis
-

Market Analysis Graph Ahead of the Future – Innovative Business Insights
#Market and Competitor Analysis #Diagram #Graph
